| |
 |
| |

IBM Envizi ESG Suite is SaaS that consolidates enterprise ESG data for analysis and reporting.
|
Base Envizi Platform
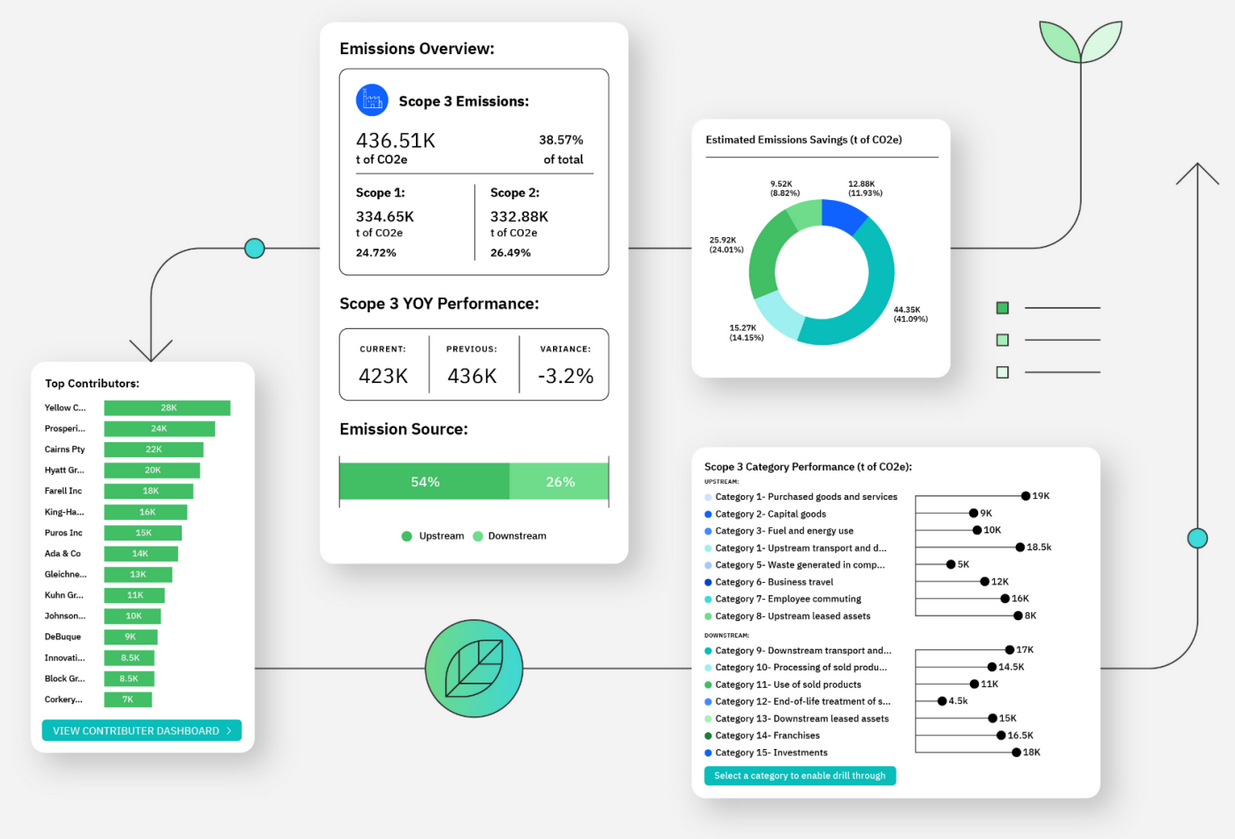 Today's leaders are excited and energized by the chance to reimagine business and commerce with a sustainability-first mindset. IBM Envizi ESG Suite removes the challenges and complexity of ESG data collection, analysis and reporting so you can harness the power of data to fast-track your success. Today's leaders are excited and energized by the chance to reimagine business and commerce with a sustainability-first mindset. IBM Envizi ESG Suite removes the challenges and complexity of ESG data collection, analysis and reporting so you can harness the power of data to fast-track your success.
We remove the challenges and complexity of ESG data collection, analysis and reporting so you can harness the power of data to fast-track your success.
Envizi's suite of cloud-based, ESG software products work together in three ways: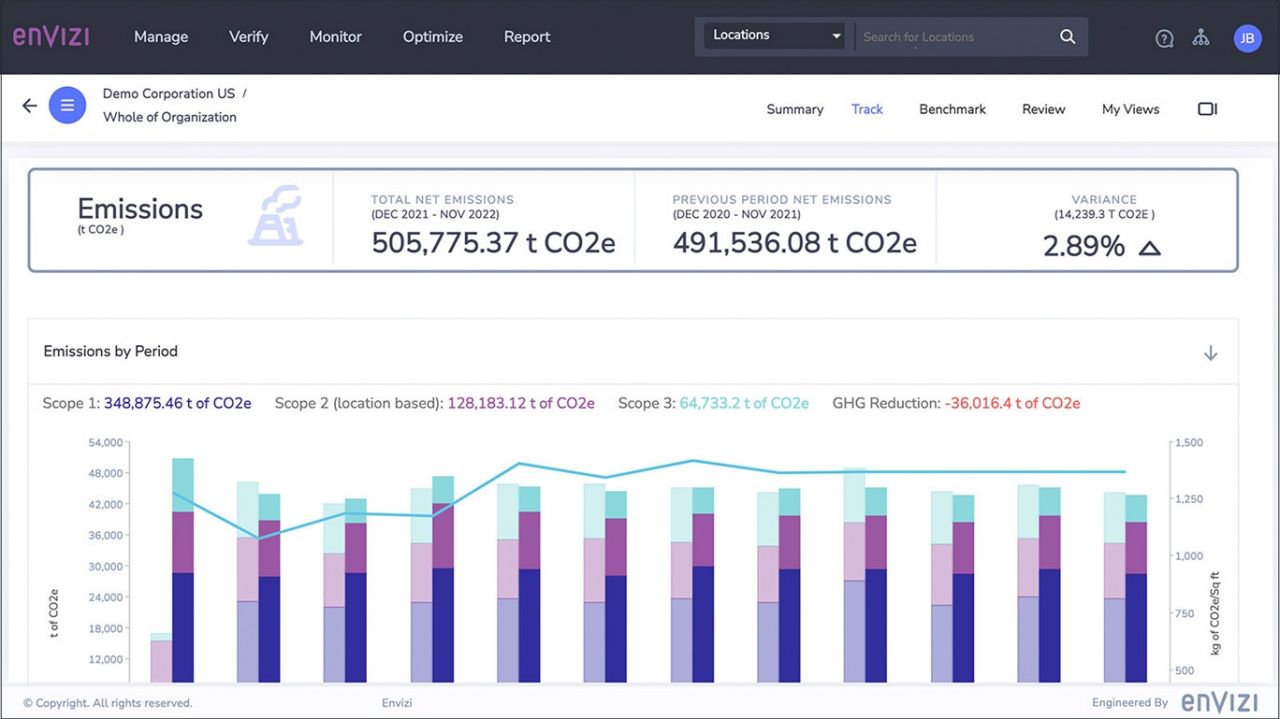
- Build a Data Foundation by automating the collection and consolidation of more than 500 ESG data types into a single system of auditable, financial-grade data.
- Streamline Reporting and Disclosures with Envizi's powerful emissions calculation engine and flexible reporting tools to meet strict internal and external requirements.
- Accelerate Decarbonization by identifying energy and emissions savings opportunities and tracking progress at every stage of your journey.
Key Benefits
 |
 |
 |
Full featured
With nine modular SaaS products, Envizi™'s sustainability software suite can consolidate your data, streamline ESG reporting, identify efficiency opportunities and inform business strategy. |
Streamlined
Automatically collect and consolidate over 500 data types from diverse sources including energy retailers, equipment (meters, sensors and solar PV systems) and building automation and management systems. |
Time saving
Collect data once, report multiple times. No more spreadsheets or manual data calculation with different emissions factors, reporting boundaries, calculation methods or metric conversions across regions. |
 |
 |
 |
Audit ready
Report with confidence knowing your ESG data has been captured in a single system of record with audit trails and financial-grade accuracy backed by more than a decade of industry experience. |
Silo Busting
Easily engage all stakeholders from the boardroom to boiler room with user-friendly and configurable tools that deliver powerful visualizations and customizable dashboards. |
Cost effective
Realize cost-saving efficiencies in the process of reducing waste, energy consumption and emissions. |
Key features accelerating sustainability performance
The power behind IBM Envizi is a robust data management foundation designed to create a single, trusted data source for all your ESG reporting and opportunity identification.
Key features include:
- Automatic data capture: From ERP and finance systems, property management databases, supplier data files and other business platforms.
- Sustainability software interoperability: Integrated with IBM Maximo, IBM Tririga and IBM Turbonomic to provide a comprehensive view of sustainability performance and opportunities.
- Data normalization and harmonization: Multi-metric, multi-currency cost and consumption data converted into comparable units and time periods.
- Data structuring and hierarchy management: Advanced data tagging for retrieval, extraction, analysis and reporting to multiple ESG frameworks with one data source.
- Data audits and health checks: All data traced back to source files with an audit record of changes made and data quality represented graphically on HealthCheck dashboards.
Explore the Modules (9)
 |
|
 |
|
 |
Scope 1, 2 GHG Accounting + Reporting
Remove the work from calculating complex Scope 1 and 2 emissions. |
Scope 3 GHG Accounting + Reporting
Calculate Scope 3 emissions using GHG Protocol methods. |
Target Setting + Tracking
Set and track your carbon-reduction targets to speed decarbonization. |
| | |
 |
 |
 |
ESG Reporting Frameworks
Simplify ESG reporting across major frameworks with one data set. |
Building Ratings + Benchmarks
View building footprint performance and send data directly to frameworks. |
Value Chain Surveys + Assessments
Capture ESG data from third parties without error-prone email or spreadsheet solutions. |
| | |
 |
 |
 |
Utility Bill Analytics
Analyze utility data and report on cost, consumption and benchmark performance. |
Interval Meter Analytics
Automate the capture and analysis of high-resolution meter data to drive energy efficiency. |
Sustainability Program Tracking
Track and manage ESG and sustainability initiatives to streamline program outcomes. |
Use Cases
Common Use Cases:
- Emissions Management: Streamline ESG reporting to meet all reporting requirements.
- ESG Reporting: Streamline ESG reporting to meet all reporting requirements.
- Decarbonization: Leverage unparalleled analytics and tools to drive emissions savings.
|

Take complex carbon emissions calculations out of spreadsheets and prepare your Scope 1 and 2 data for emissions reporting
|
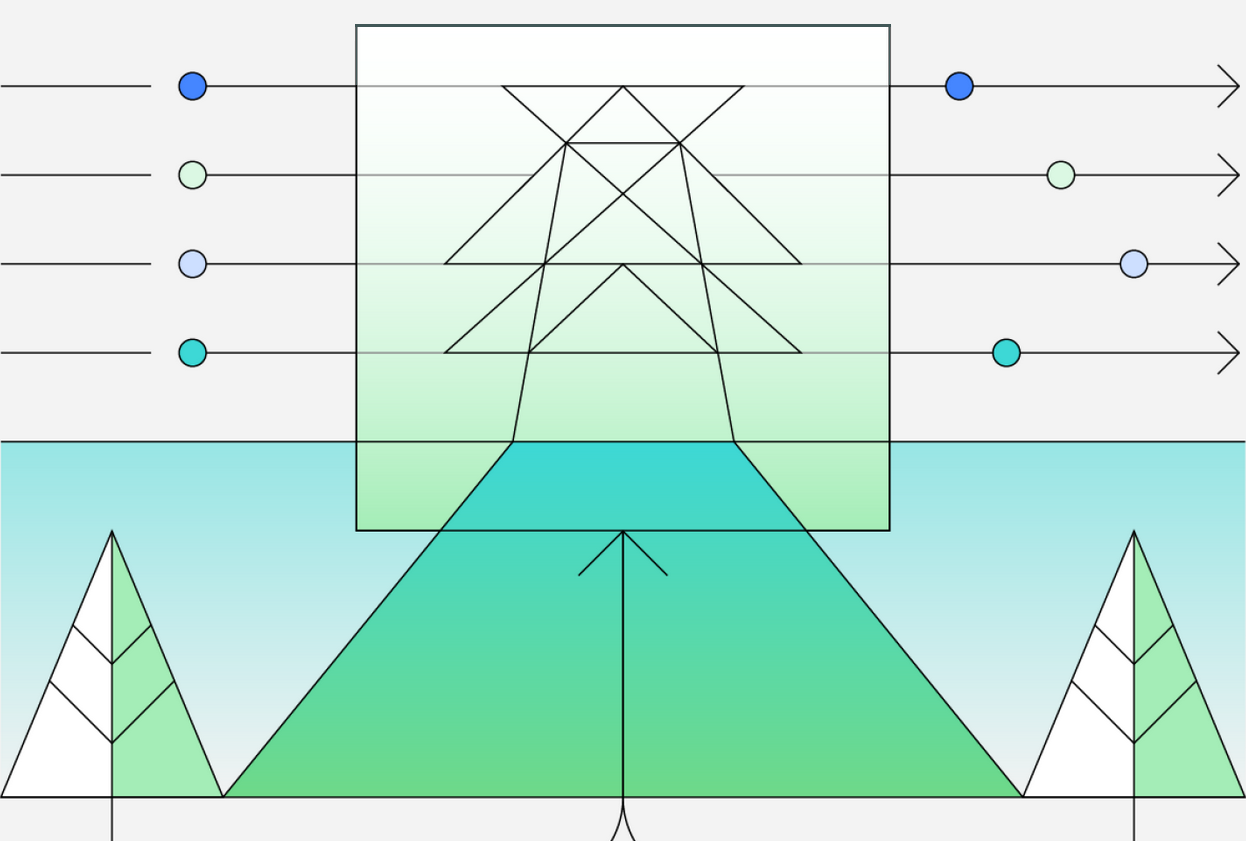
A powerful emissions calculation engine
IBM® Envizi™: Scope 1, 2 GHG Accounting + Reporting carbon accounting software streamlines your entire process with a powerful emissions calculation engine built on the GHG Protocol.
Utilizing over 40,000 emissions factors and a factor selection algorithm, it takes the sting out of GHG calculations and the preparation of emissions data for ESG reporting while standing up to the scrutiny of external auditors with features like:
Factor selection algorithm
The built-in factor selection algorithm automatically cycles through a filtered list of factors to arrive at a match on data type, factor set, region and time period.
Market-based emissions
Envizi automatically manages and applies residual mix factors to grid electricity consumption not already covered by renewable energy certificates.
Custom dashboards
Visually appealing dashboards allow for the creation of customized emissions performance reports designed to meet different stakeholder requirements.
Module features
 Emissions calculation engine Emissions calculation engine
Built on the GHG Protocol, the embedded emissions calculation engine incorporates a global library of over 40,000 managed emissions factors, including those from the US EPA, eGRID, DEFRA, country electricity factors from IEA, residual mix factors from the US and Europe and publicly available frameworks in other regions.
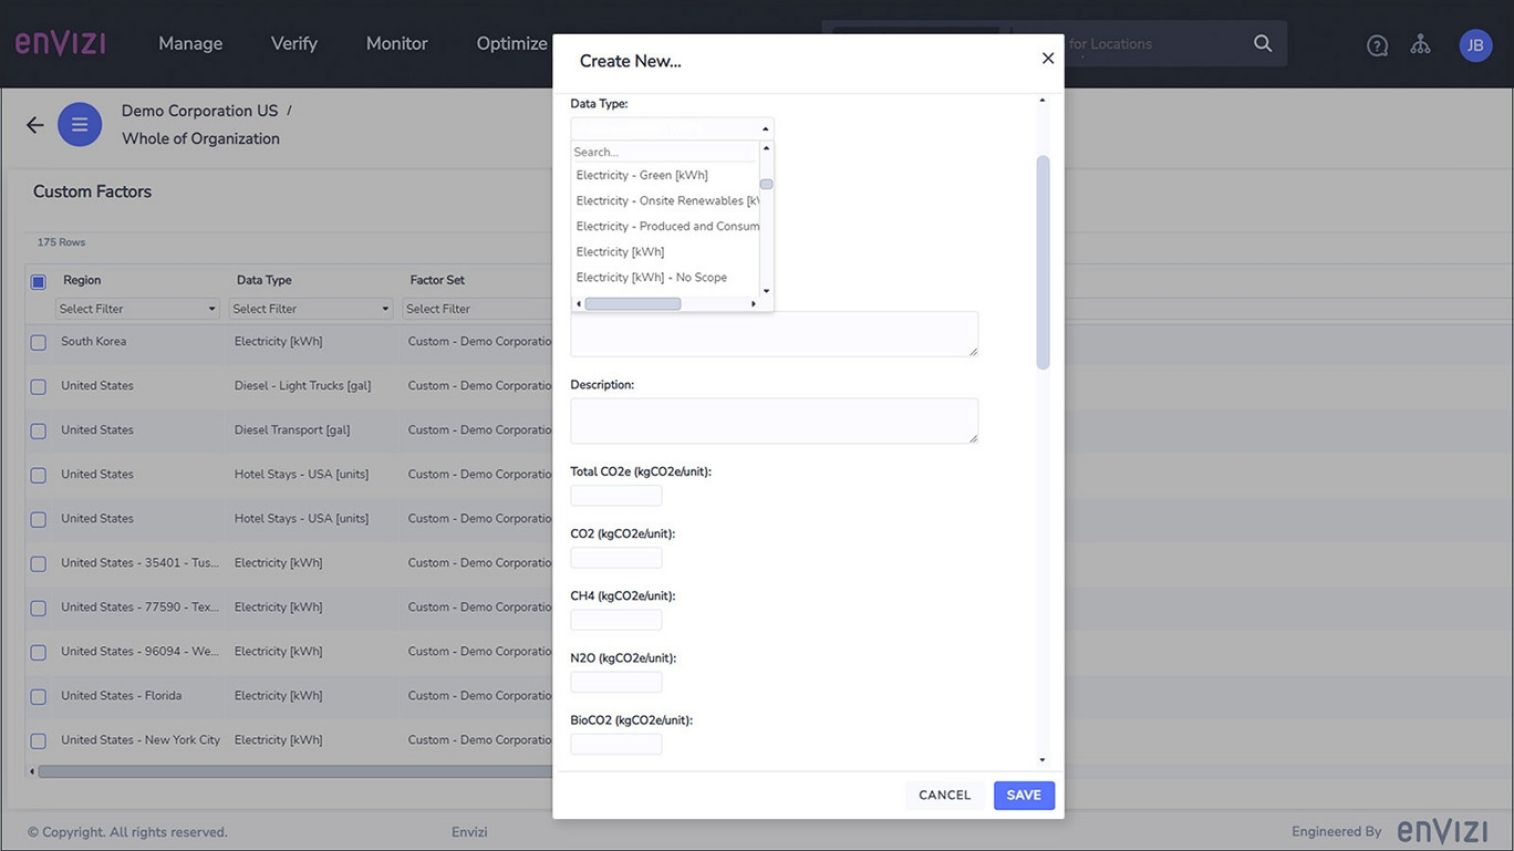 Custom emissions factors Custom emissions factors
Add custom and third-party emission factor sets to address your organization's emissions reporting needs.
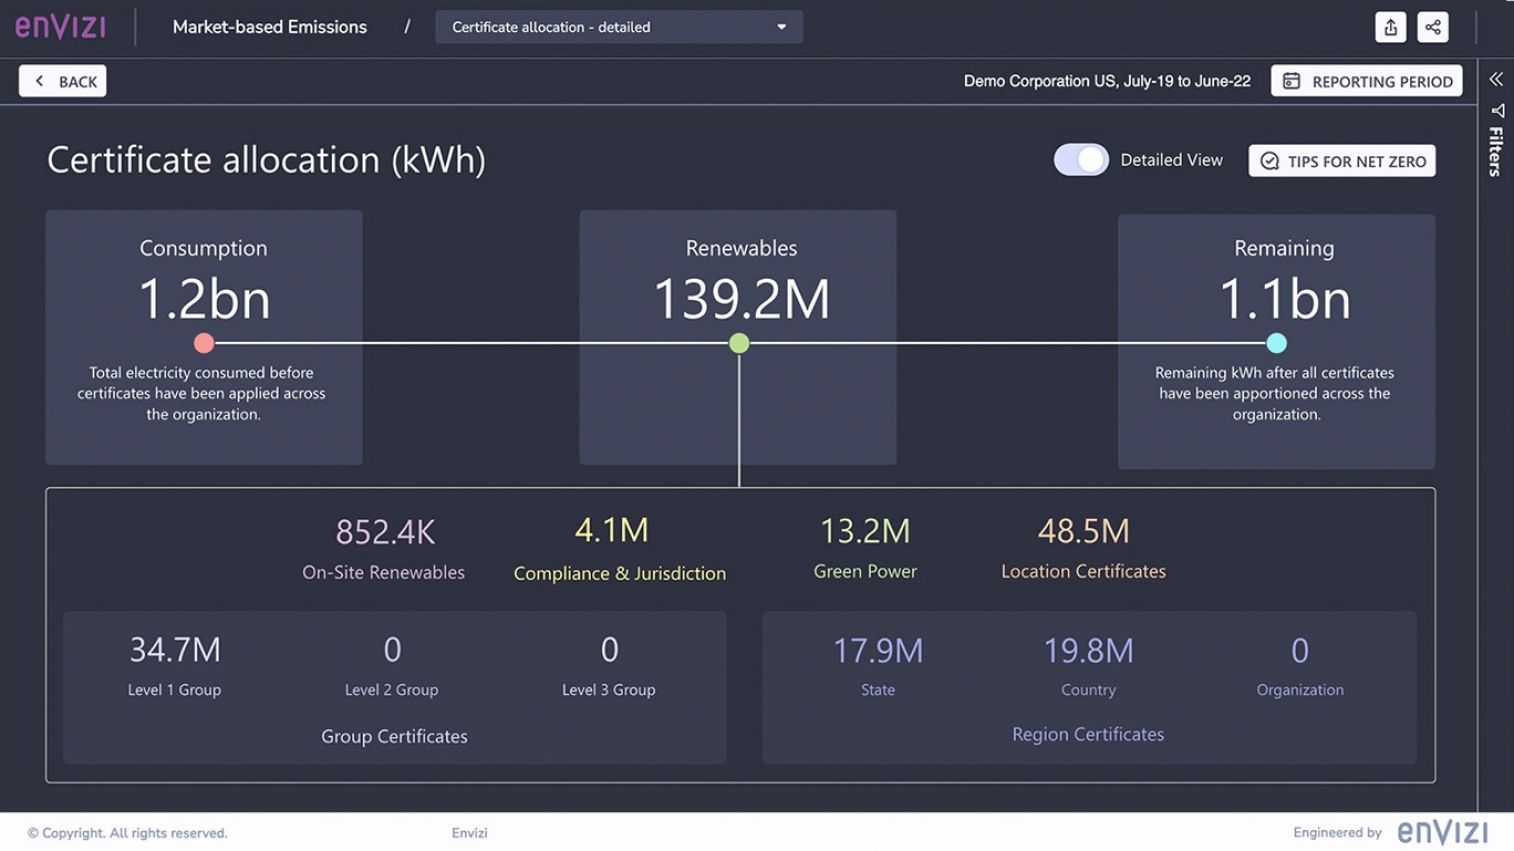 GHG reductions management GHG reductions management
Categorize carbon offsets and renewable energy certificates as GHG reductions outside of your carbon inventory to ensure accurate emissions calculations.
Built on the GHG Protocol
 GHG Protocol GHG Protocol
This tool has been reviewed by the World Resources Institute for conformance with the GHG Protocol Corporate Standard.
GHG reporting made easier
 |
 |
 |
Simplified calculations
Automation of carbon emission factor calculations and standardization of units and currencies across regions mean a spreadsheet-free world. |
Increased visibility
View the carbon emissions footprint of your entire organization, region or individual location and compare it to a previous period or baseline year. |
Reporting flexibility
Customizable organizational hierarchy allows for structuring thousands of streams of Scopes 1 and 2 data to meet reporting requirements. |
|

Leverage the power of AI to accelerate Scope 3 emissions calculations for ESG reporting and disclosures
|
Calculate Scope 3 emissions with speed and accuracy
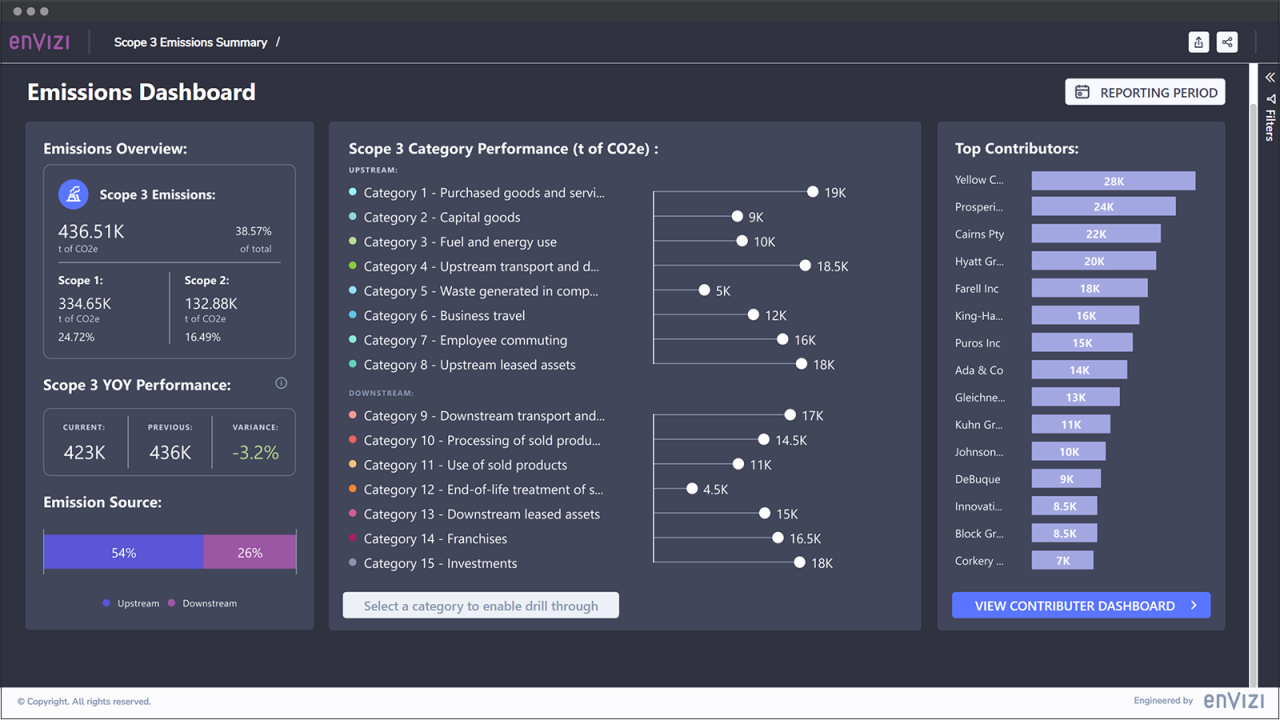 IBM® Envizi™: Scope 3 GHG Accounting + Reporting software leverages AI to help make emissions calculations more efficient. It includes flexible reporting tools to deliver value chain insights and streamline disclosures and offers embedded Scope 3 emissions factor libraries to make calculations less time consuming. IBM® Envizi™: Scope 3 GHG Accounting + Reporting software leverages AI to help make emissions calculations more efficient. It includes flexible reporting tools to deliver value chain insights and streamline disclosures and offers embedded Scope 3 emissions factor libraries to make calculations less time consuming.
Automate emissions calculations
Envizi offers coverage across all Scope 3 categories, utilizing a GHG calculation engine to apply GHG Protocol-compliant calculation methods underpinned by a robust data management system. Envizi supports over 40 variations of GHG calculation methodologies across the Scope 3 categories.
Identify emissions hotspots
Envizi's advanced data capture, tagging, and management capabilities help you identify where to focus emissions reduction efforts. Plus, powerful visualizations and customizable reporting functionality underpinned by PowerBI help you demonstrate impact clearly.
Reporting for frameworks and stakeholders
With prebuilt templates aligned to framework questionnaires and a detailed dashboard that allows users to visualize the results in a few clicks, Envizi is designed to streamline Scope 3 performance reporting and discolsures.
Module features
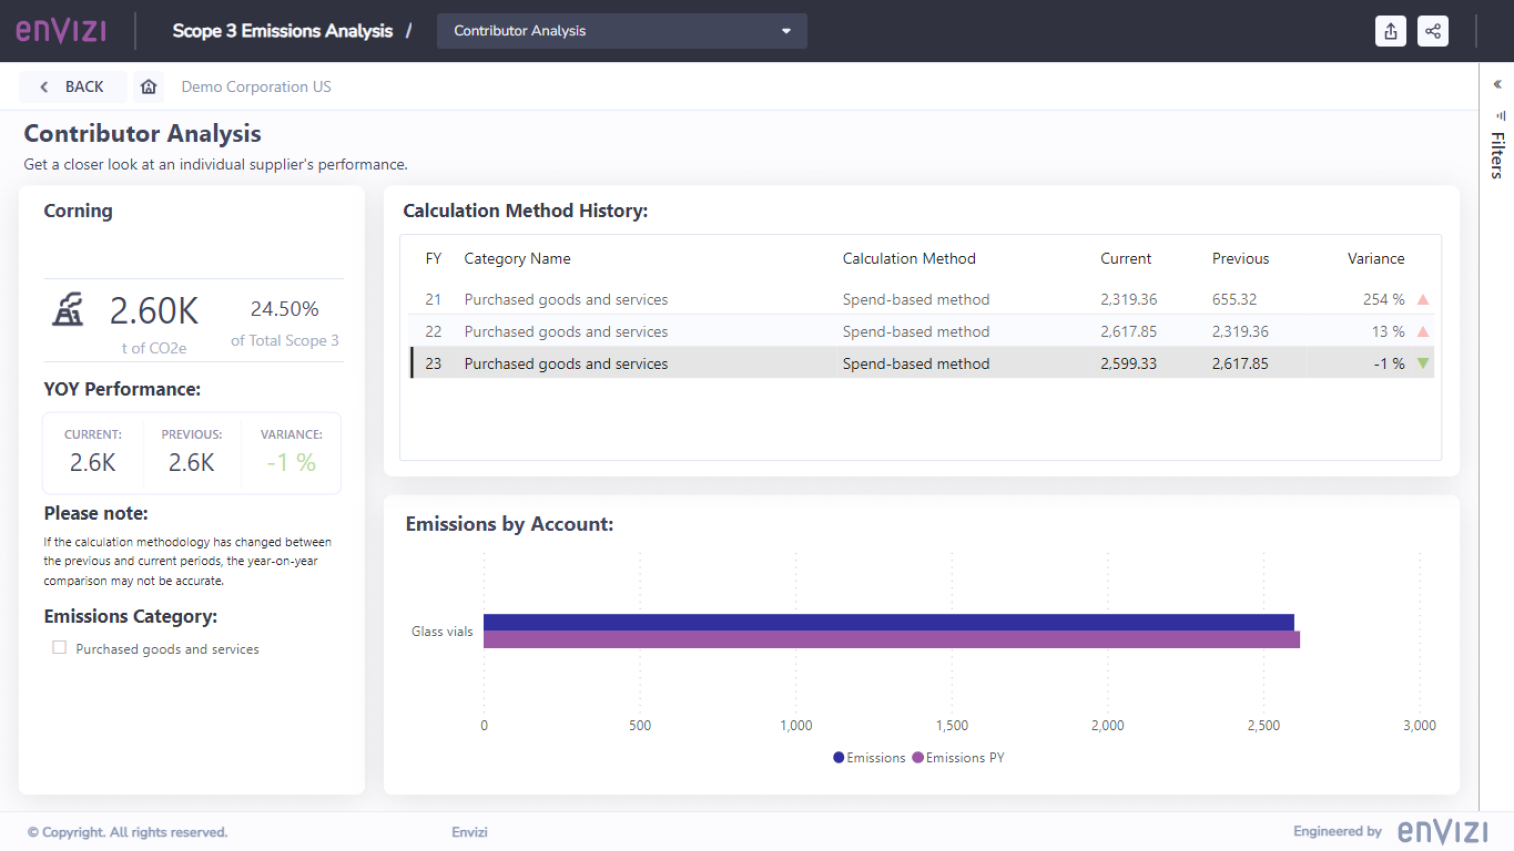 Robust calculation engine Robust calculation engine
Scope 3 emissions are automatically calculated utilizing the relevant GHG Protocol calculation method. AI-driven Natural Language Processing (NLP) models support data categorization for spend-based calculations, and emissions factors are drawn from embedded libraries.
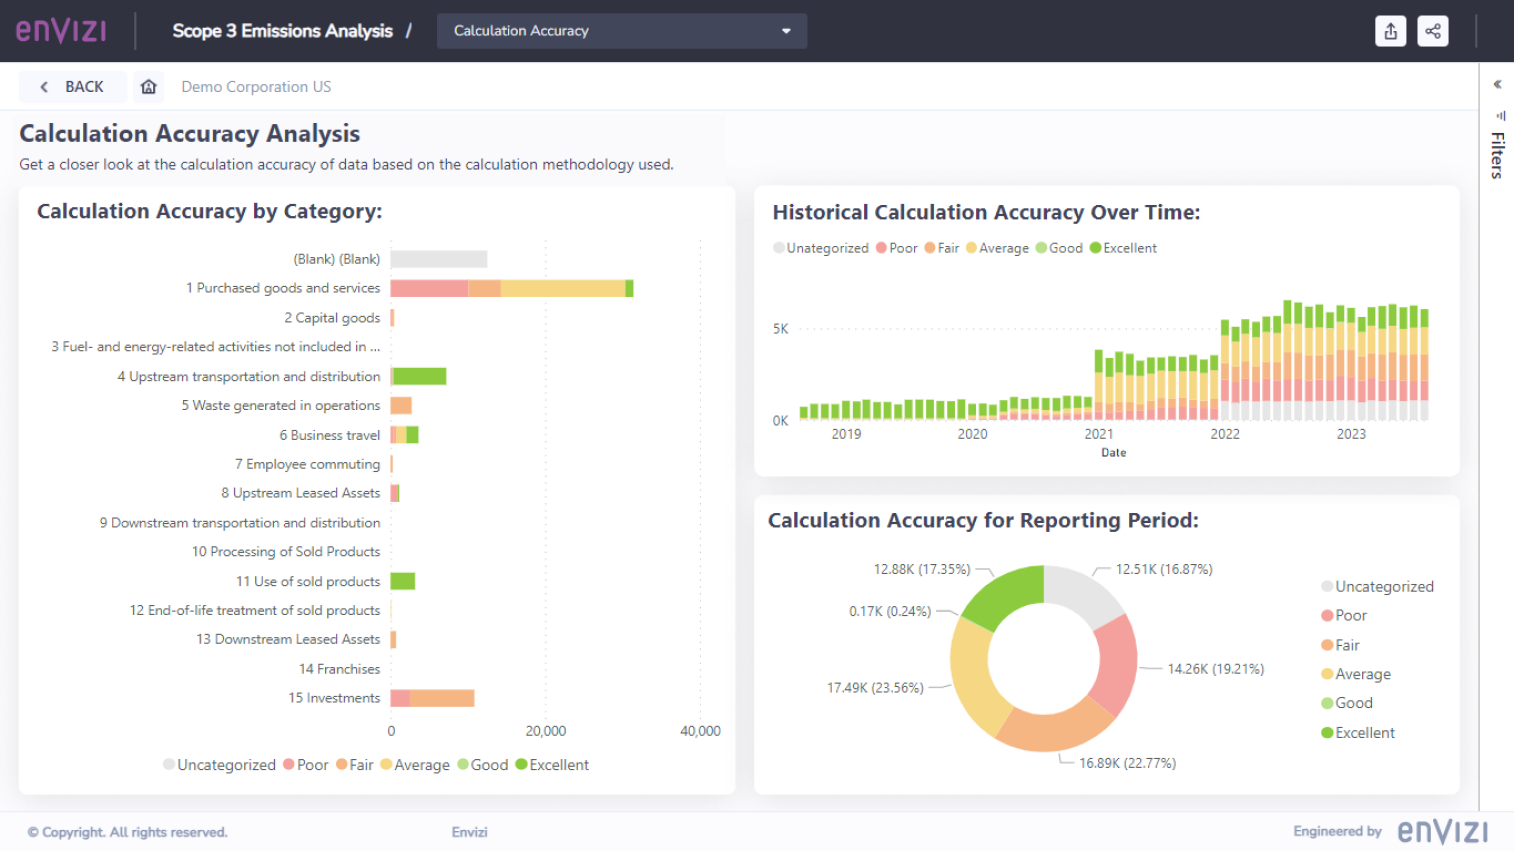 Calculation accuracy summary Calculation accuracy summary
Summaries of calculation accuracy by data type - based on calculation methodology - help improve your sustainability reporting accuracy year-on-year and identify any data governance issues that arise.
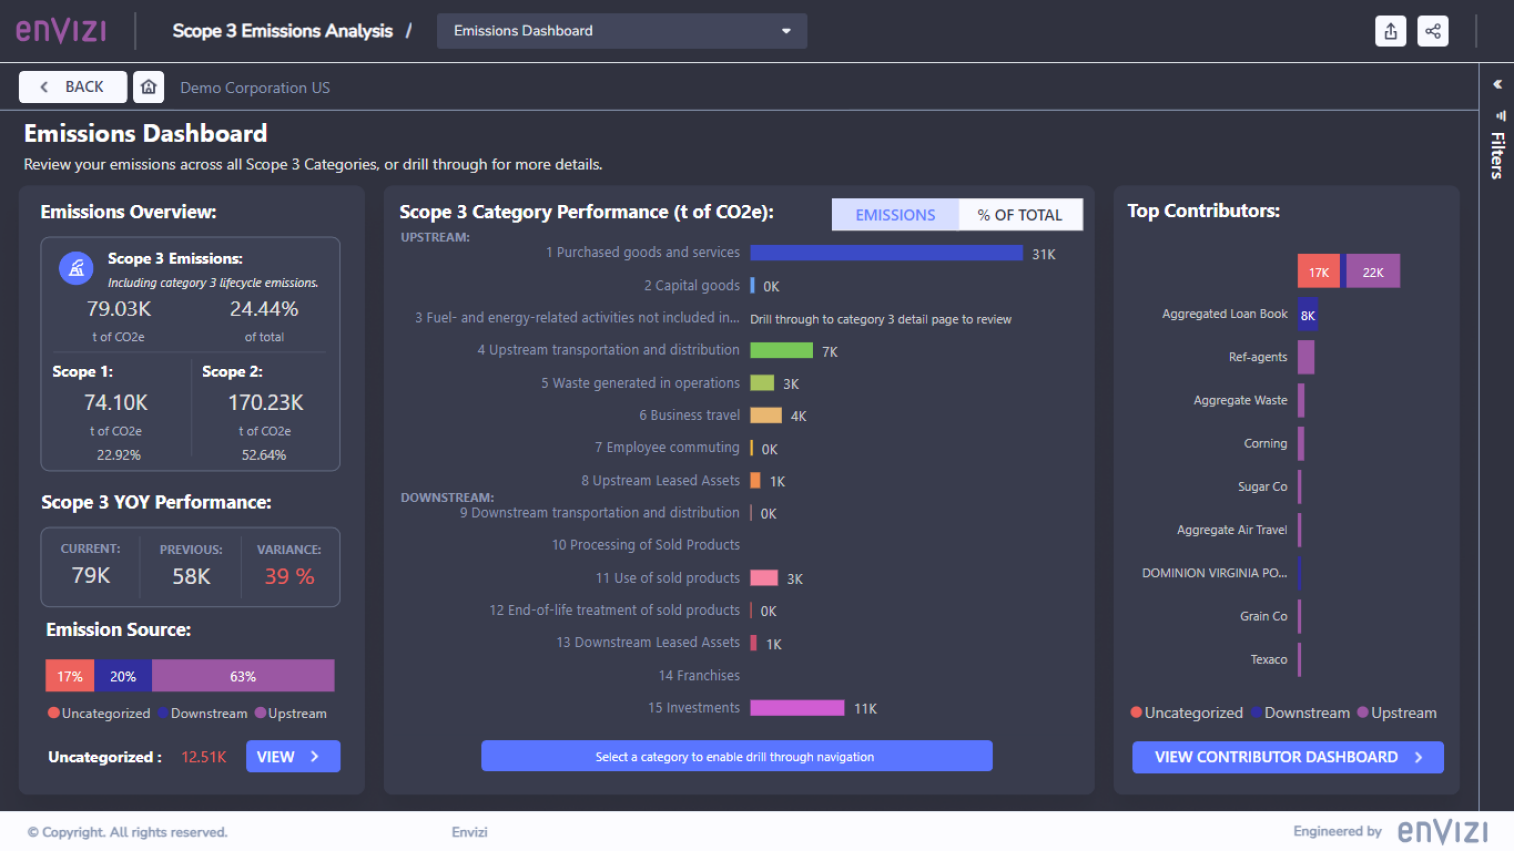 PowerReports PowerReports
Customizable Microsoft Power BI-embedded Envizi PowerReports generate data visualizations to help keep stakeholders informed on Scope 3 emissions performance.
GHG reporting made easier
 |
 |
 |
Prepare for audit needs
Satisfy auditors with robust data management tools aligned with the GHG Protocol standard. |
Reduce tedious, manual work
Streamline data categorization for emissions calculations utilizing the embedded watsonx.ai NLP model. |
Report with insights
Gain clear, consistent Scope 3 emissions insights to support your sustainability performance management and reporting. |
Built on the GHG Protocol
 GHG Protocol GHG Protocol
This tool has been reviewed by the World Resources Institute for conformance with the GHG Protocol Corporate Standard.
|

Set and track the performance of your consumption-, energy- and emissions-reduction targets to help accelerate the delivery of your decarbonization goals
|
Track your decarbonization performance with less effort
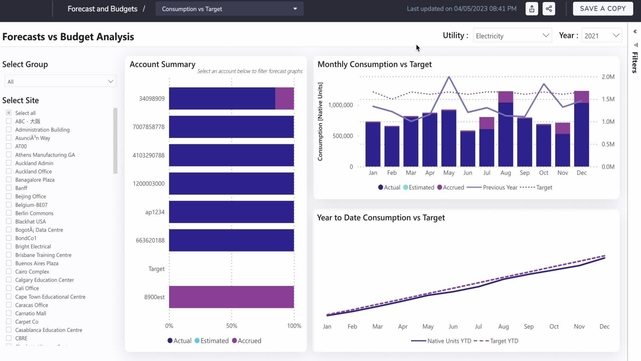 IBM® Envizi™: Target Setting + Tracking simplifies and automates the process of capturing and tracking GHG performance against targets at different levels of the organization. With all your GHG emissions data available in one place, organizations can easily set different types of targets, including energy, cost, emissions or intensity. IBM® Envizi™: Target Setting + Tracking simplifies and automates the process of capturing and tracking GHG performance against targets at different levels of the organization. With all your GHG emissions data available in one place, organizations can easily set different types of targets, including energy, cost, emissions or intensity.
Intuitive dashboards help you identify carbon emissions reduction opportunities, develop a carbon management strategy and track the impact of your various sustainability projects.
Module features
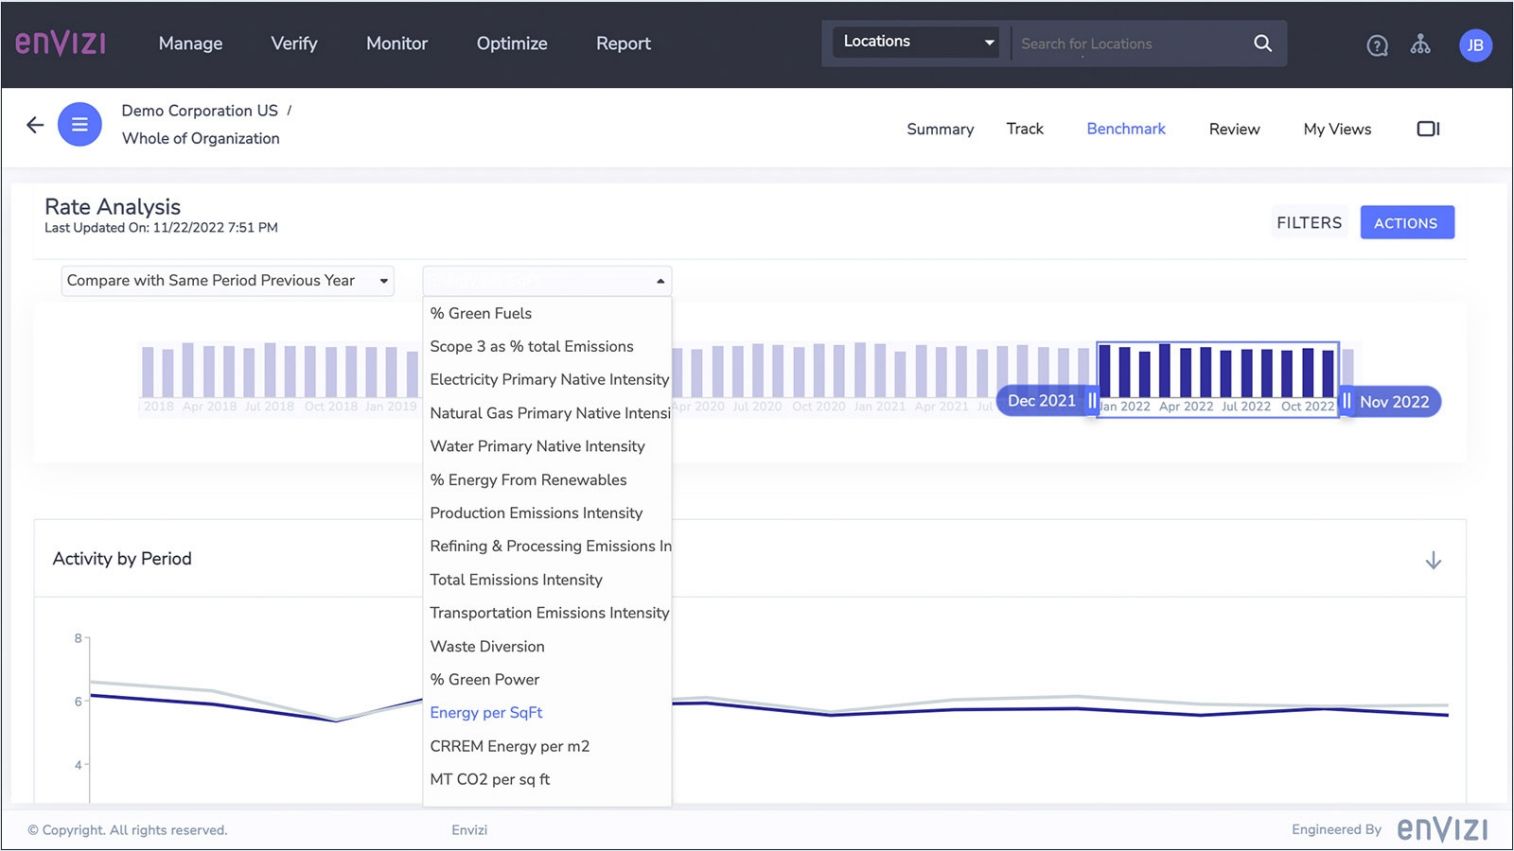 Rate analysis dashboard Rate analysis dashboard
Set intensity style consumption-, emissions- or energy-reduction targets and compare actual performance against those targets.
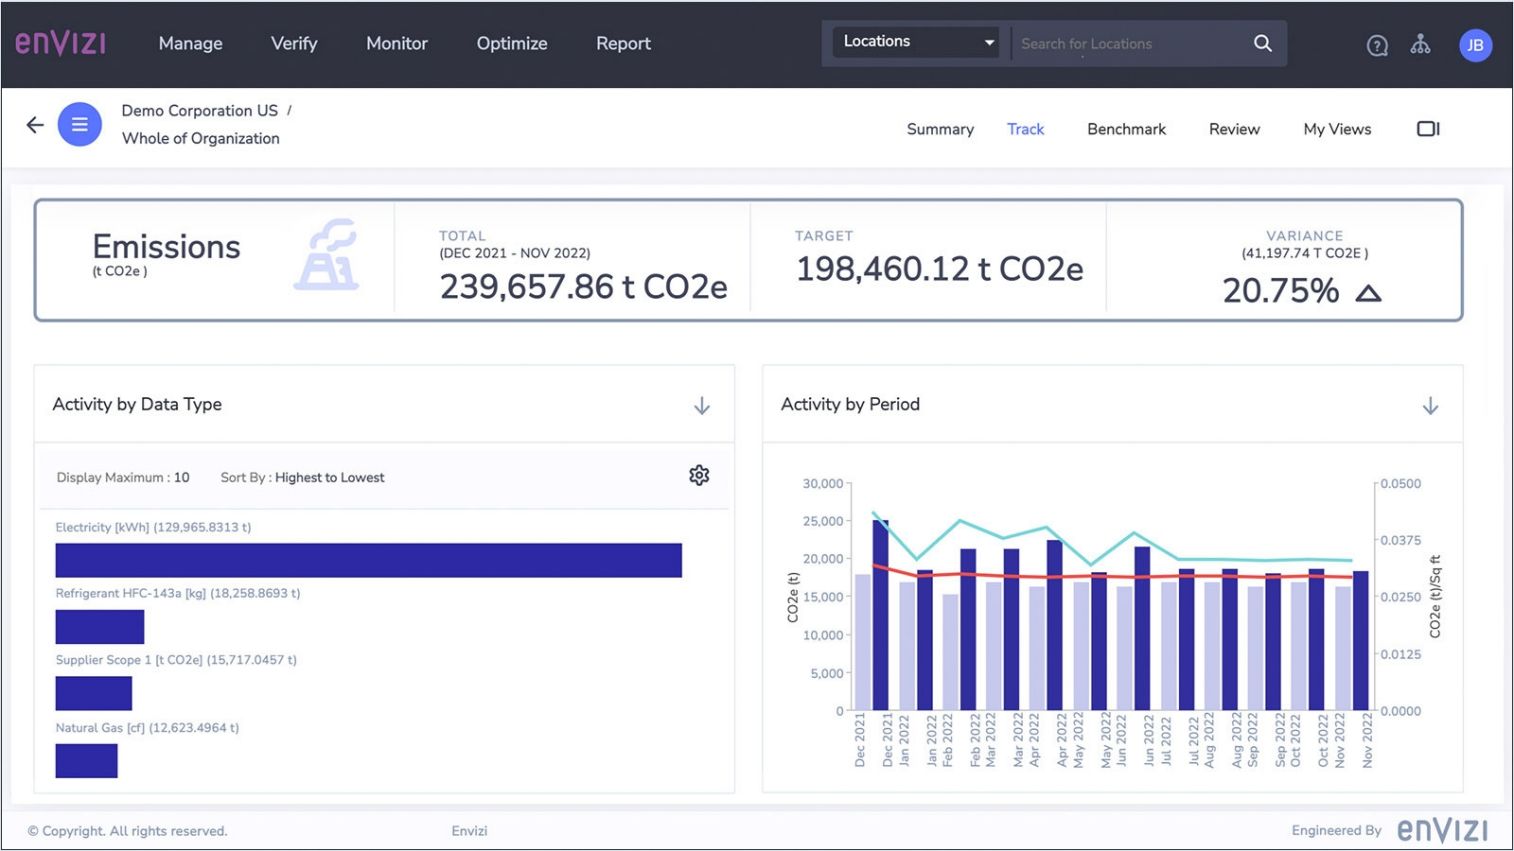 Performance dashboards Performance dashboards
Compare against absolute bottom-up targets and budgets in standard performance dashboards.
More features
Keep your carbon emissions data audit ready with the GHG emissions management suite of modules from Envizi.
Bulk data uploads
Bulk create and edit target data using blank or pre-populated Excel templates. |
PowerReports
Easily compare projects across your portfolio and supply chain with Microsoft Power BI-embedded Envizi PowerReports. |
Benefits
 |
 |
 |
Faster insights
Eliminate spreadsheets and manual processes to identify GHG-reduction opportunities faster. |
Improved accuracy
Track performance more accurately and access results when and how you need them. |
Increased engagement
Built-in tools help engage stakeholders and improve accountability for results at all levels of the organization. |
|

Save time and effort reporting to multiple ESG frameworks with streamlined, finance-grade data management
|
Report to multiple ESG frameworks with one data set
IBM® Envizi™: ESG Reporting Frameworks streamlines the management of compiling and reviewing the volumes of data needed across multiple teams and stakeholders.
It includes over 1,000 questions from all major international reporting frameworks, such as SASB, GRI, UN SDGs and TCFD, which are kept up to date as reporting requirements change.
In addition, responses can also be reused from previous years and similar responses can be reused across different frameworks.
Module features
ESG framework integration
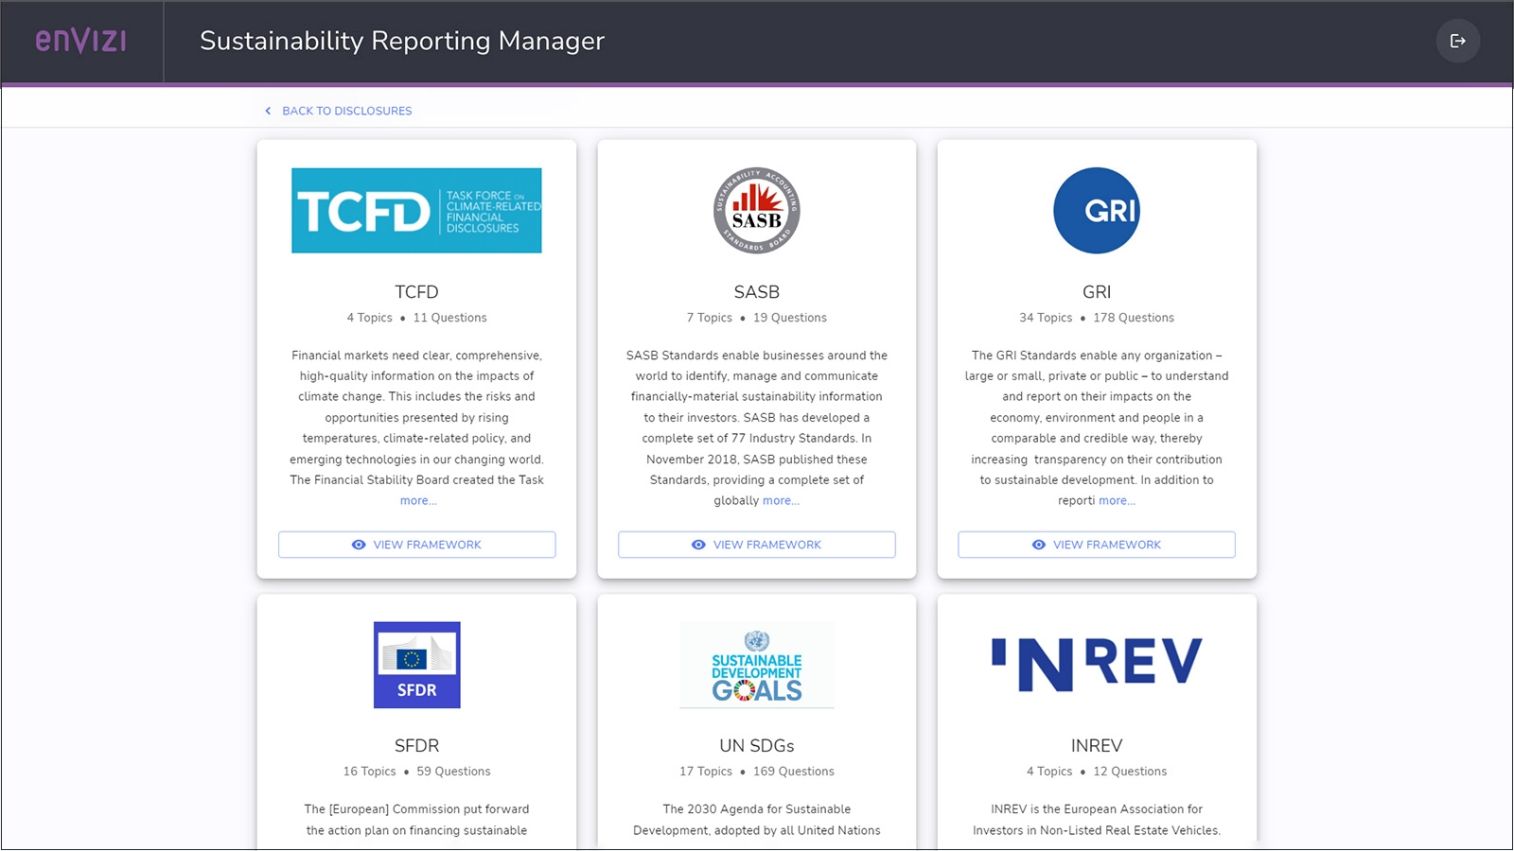 Input all data against framework questions within Envizi so you don't need to access each external reporting framework separately. Input all data against framework questions within Envizi so you don't need to access each external reporting framework separately.
Custom questions
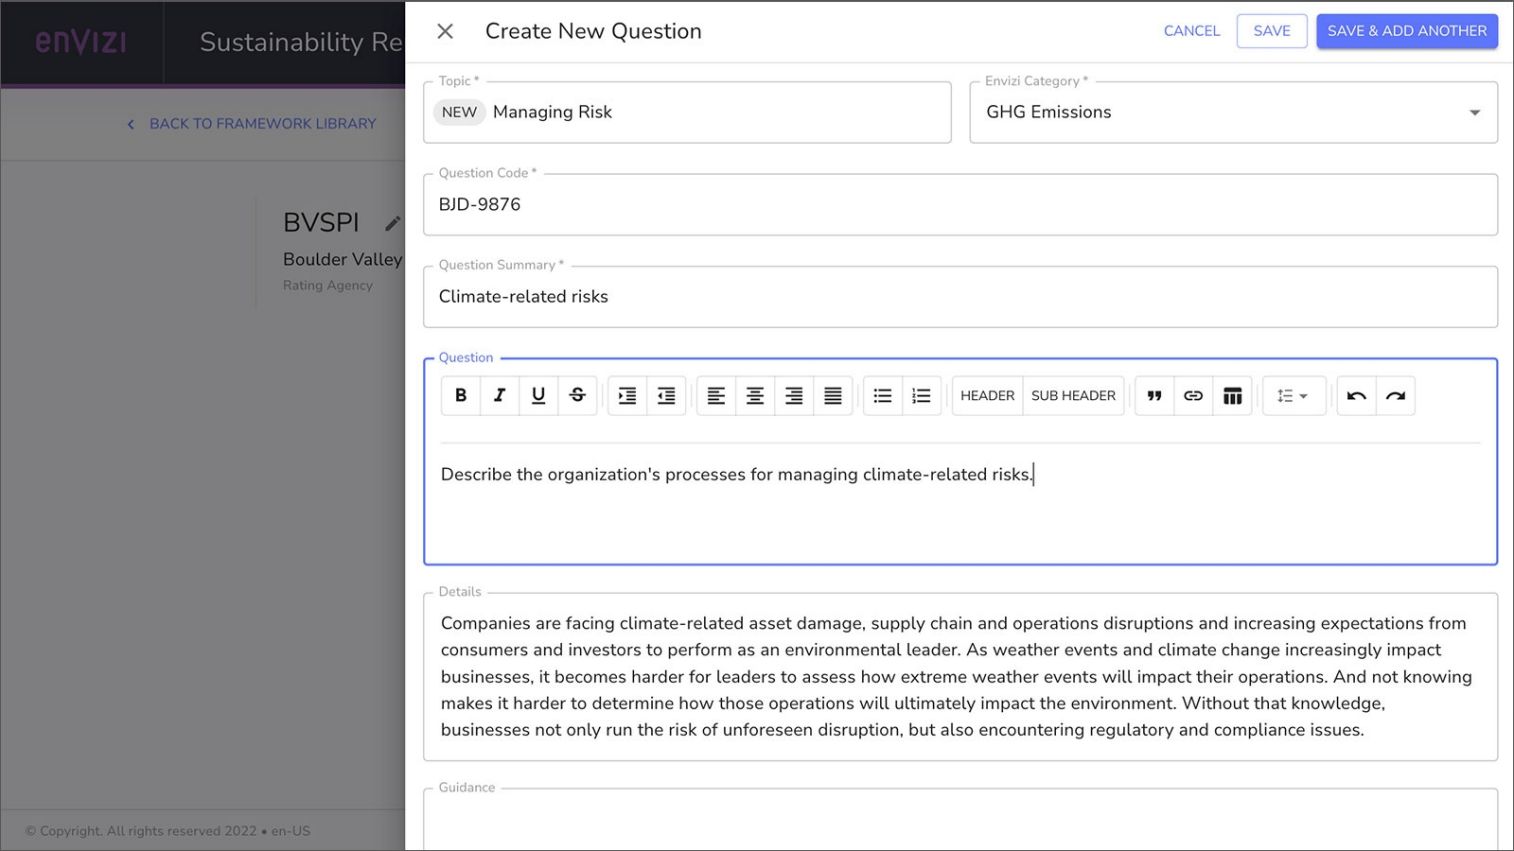 Create custom questions to track specific reporting requirements not covered by the public ESG frameworks. Create custom questions to track specific reporting requirements not covered by the public ESG frameworks.
Best practice guidance
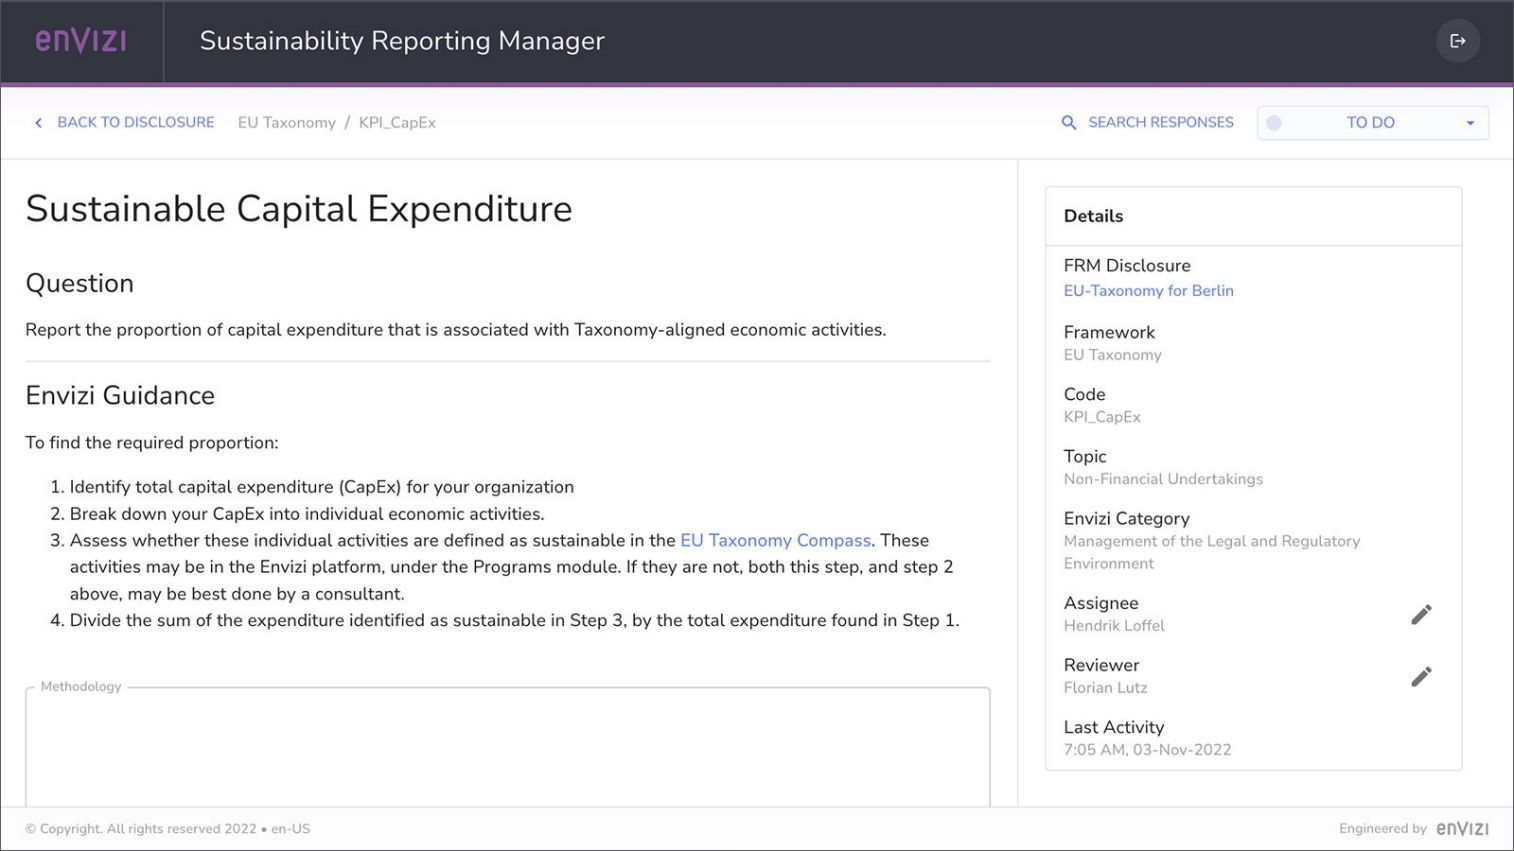 Framework questions include Envizi's best practice guidance on responding, as well as where to source the ESG metrics in Envizi. Framework questions include Envizi's best practice guidance on responding, as well as where to source the ESG metrics in Envizi.
More features
Workflow tools
Keep your team on track with workflow tools that motivate stakeholders to stay on task and on schedule throughout the process. |
Multi-team support
Dashboard access for global teams eliminates the need for error-prone data collection methods, such as email and shared documents. |
Export flexibility
Export specific fields or an entire report to PDF or Microsoft Word, including all attachments and supporting documentation. |
Benefits
 |
 |
 |
Keep it simple
Reduce reporting complexity by accessing all ESG performance data for multiple frameworks in a single, unified platform. |
Avoid repetition
Save time by reusing similar responses across different frameworks, as well as responses from previous years. |
Be the conductor
Systematically manage all of the questions, answers, teams, workflow and supporting documents required to align with external reporting frameworks. |
|

Capture building footprint and utility data, calculate ratings and benchmark and track building performance in one place
|
Simplify data collection and reporting across your property portfolio
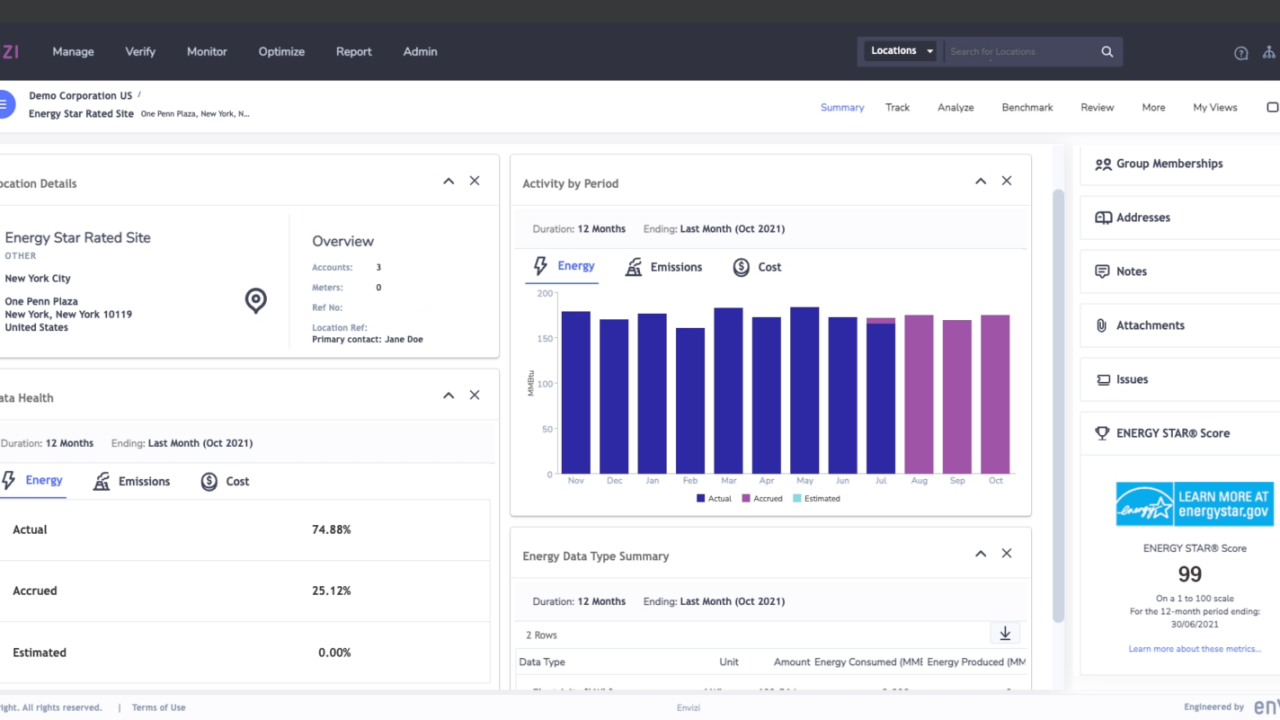 IBM® Envizi™: Building Ratings + Benchmarks reporting software allows you to capture, analyze and track building footprint metrics across your entire property portfolio. IBM® Envizi™: Building Ratings + Benchmarks reporting software allows you to capture, analyze and track building footprint metrics across your entire property portfolio.
It also features dedicated API connectors and algorithms, so you can report directly into the Global Real Estate Sustainability Benchmark (GRESB) and ENERGY STAR® frameworks and get indicative ratings from National Australian Built Environment Rating System (NABERS).
Module features
GRESB reporting API
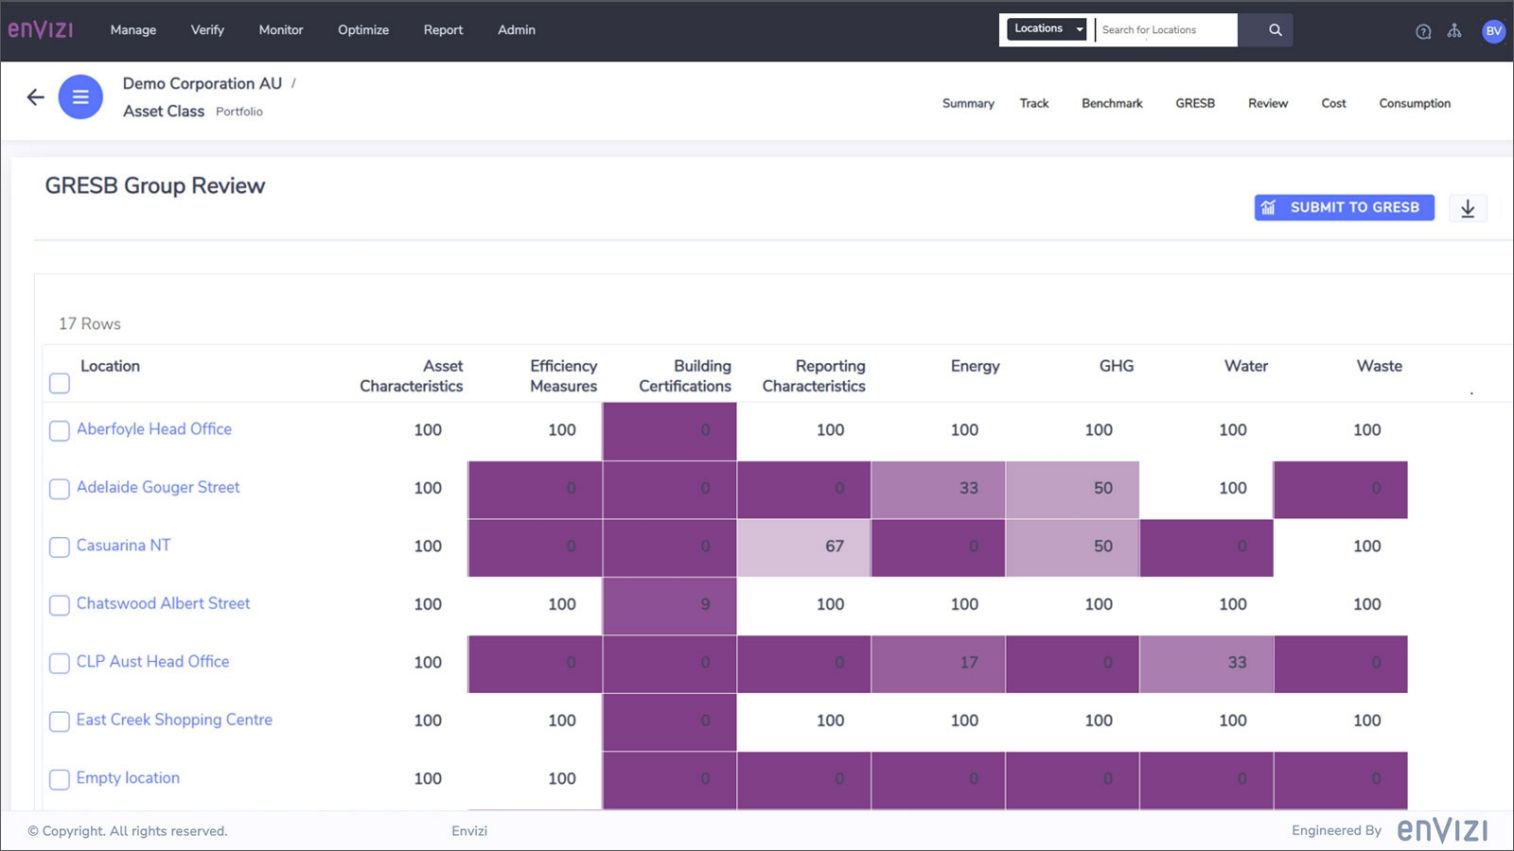 As an official GRESB Data Partner, Envizi captures, tags and reports on GRESB performance indicators directly via API to the GRESB Portal in a format compatible with the framework. As an official GRESB Data Partner, Envizi captures, tags and reports on GRESB performance indicators directly via API to the GRESB Portal in a format compatible with the framework.
ENERGY STAR® integration
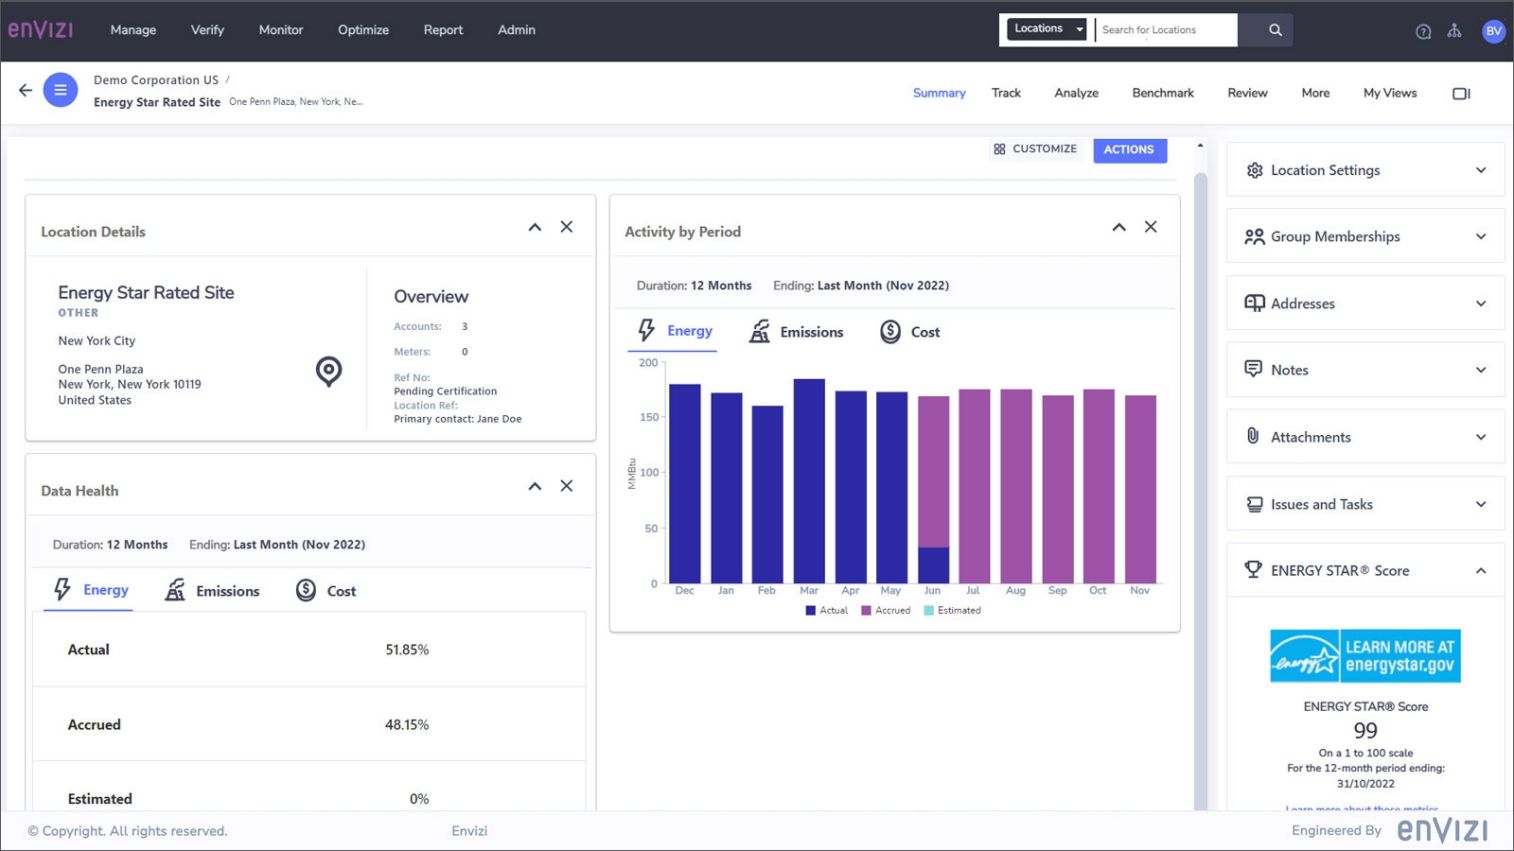 Integrate directly with the ENERGY STAR Portfolio Manager to receive official ENERGY STAR scores and track current and historical performance trends. Integrate directly with the ENERGY STAR Portfolio Manager to receive official ENERGY STAR scores and track current and historical performance trends.
Built-in NABERS algorithm
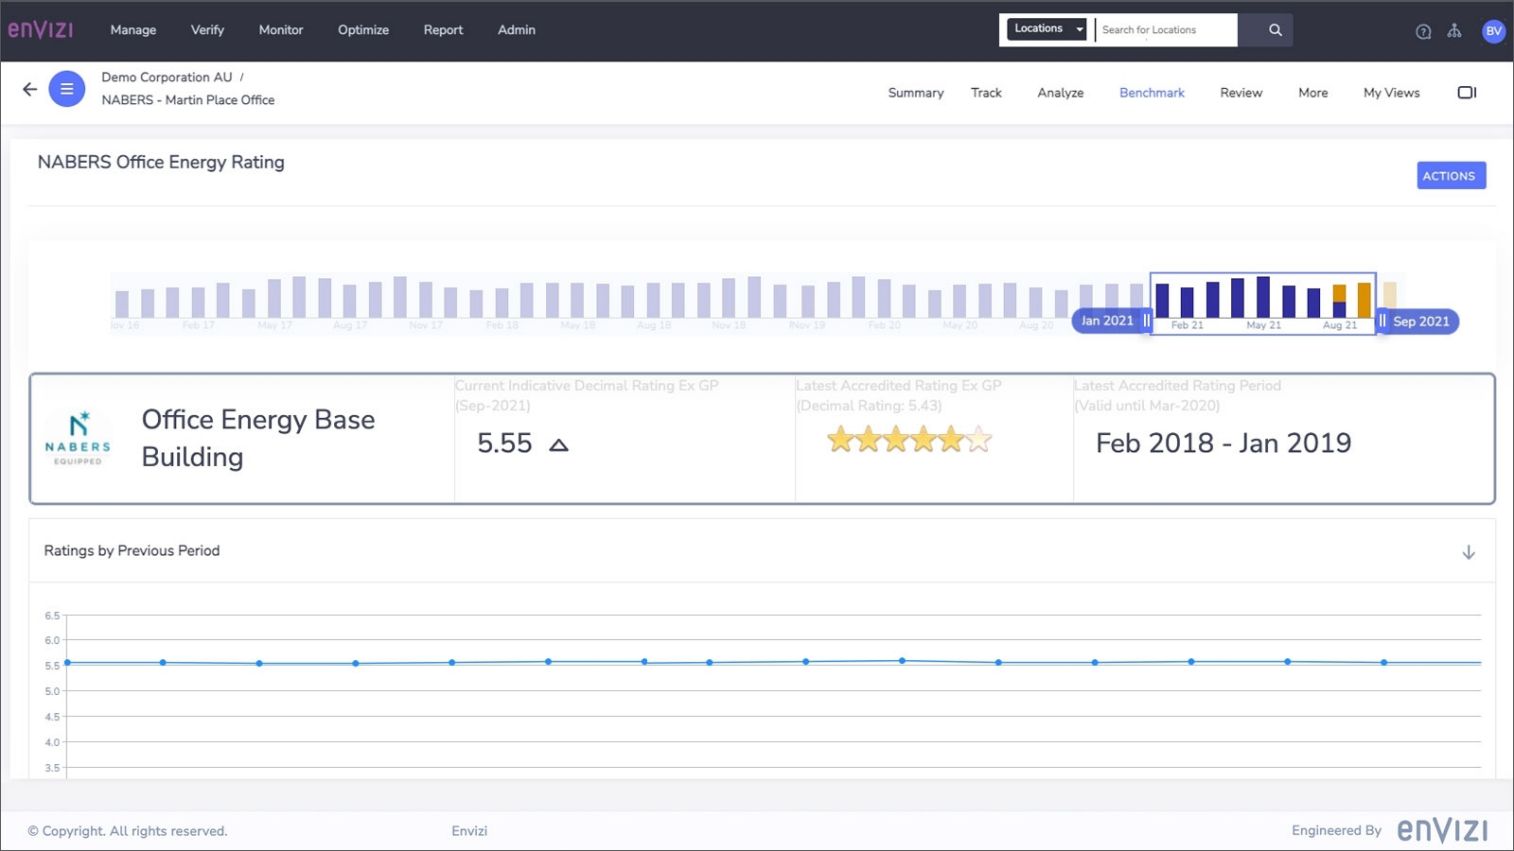 Calculate indicative NABERS Office, Energy and Water ratings to the decimal using the built-in NABERS algorithm for easy and accessible portfolio-level reporting. Calculate indicative NABERS Office, Energy and Water ratings to the decimal using the built-in NABERS algorithm for easy and accessible portfolio-level reporting.
Benefits
 |
 |
 |
Streamline data collection
Capture building performance data systematically throughout the year and store it in a centralized location to support your building and portfolio ratings. |
Save time and effort
Reporting tools allow you to send data directly to individual frameworks without needing to manipulate data in spreadsheets outside of the Envizi platform. |
Increase ratings potential
Track indicative building ratings performance against targets on a monthly basis to provide actionable insights for making improvements that bolster ratings. |
|

Collect ESG data from third parties for value chain analysis within a single portal and assess ESG performance for competitive advantage
|
Securely capture ESG data from third parties for value chain analysis
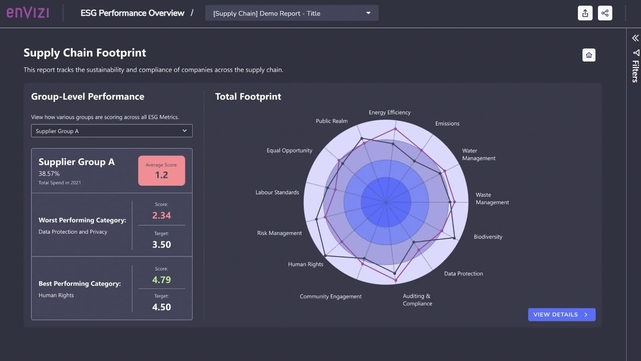 IBM® Envizi™: Value Chain Surveys + Assessments, an interactive value chain analysis software, simplifies the capture of ESG data from stakeholders for value chain analysis. IBM® Envizi™: Value Chain Surveys + Assessments, an interactive value chain analysis software, simplifies the capture of ESG data from stakeholders for value chain analysis.
This digital portal allows stakeholders to input qualitative and quantitative ESG performance data against your customized survey templates. It further streamlines the value chain analysis process by eliminating the need for manual data consolidation through email, helping save time and effort.
Module features
Stakeholders can comment in the portal
 Enable your value chain stakeholders to ask questions and communicate with you or other team members through a single portal. Enable your value chain stakeholders to ask questions and communicate with you or other team members through a single portal.
Custom scoring system
 Create a custom scoring system to assess and benchmark the ESG performance of your value chain stakeholders based on their survey responses. Create a custom scoring system to assess and benchmark the ESG performance of your value chain stakeholders based on their survey responses.
Upload files and supporting documents
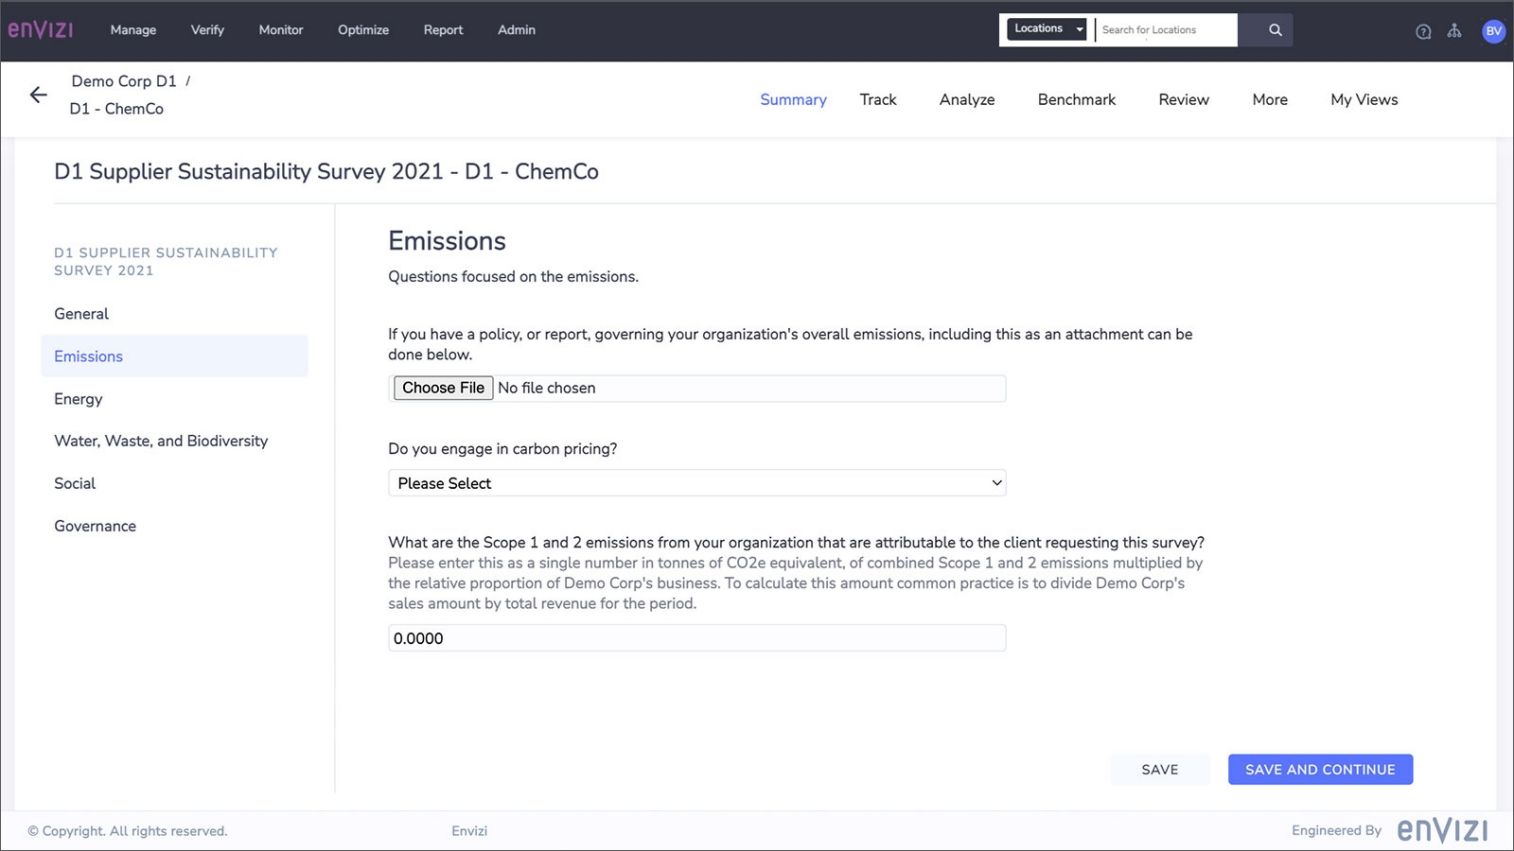 Allow your value chain stakeholders to attach supporting documentation such as reports or policies, against your customized survey questions. Allow your value chain stakeholders to attach supporting documentation such as reports or policies, against your customized survey questions.
More features
Custom stakeholder surveys
Create your own survey based on the ESG metrics you want to track. This can be easily completed by stakeholders and responses are automatically consolidated for value chain analysis. |
Visualized risk assessment
Use the ESG risk assessment tool to visualize stakeholder data for value chain analysis, identify compliance risks and compare scores against your ESG targets. |
Benefits
 |
 |
 |
Scope 3 reporting
Allow value chain stakeholders to submit ESG data directly into the portal, so you can integrate this data into your Scope 3 GHG inventory for reporting. |
Single portal
Eliminate multiple spreadsheets and email trails by consolidating responses from stakeholders in a single portal, saving time and effort. |
Increased visibility
Identify where the ESG performance risks are in your organization's value chain and make decisions to inform your ESG strategy. |
|

Consolidate and analyze all your utility billing data in one place to identify anomalies and reduce costs and consumption
|
Consolidate utility billing data across your portfolio
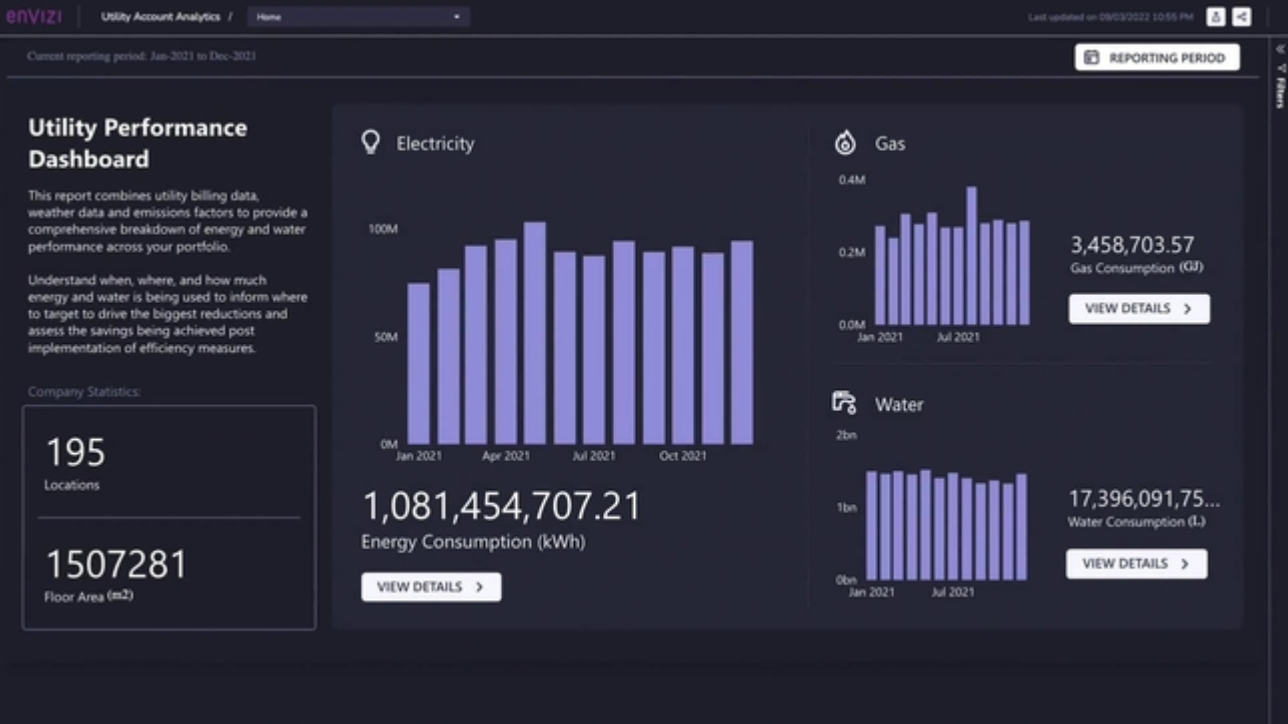 IBM® Envizi™: Utility Bill Analytics software saves you time by consolidating your utility billing data, automating conversions and calculations and normalizing energy performance for weather and KPI metrics. IBM® Envizi™: Utility Bill Analytics software saves you time by consolidating your utility billing data, automating conversions and calculations and normalizing energy performance for weather and KPI metrics.
Not only does it eliminate the need for complex spreadsheets, it also helps inform smarter energy efficiency decisions across your portfolio by identifying cost and consumption outliers and variances.
Module features
Utility performance analysis
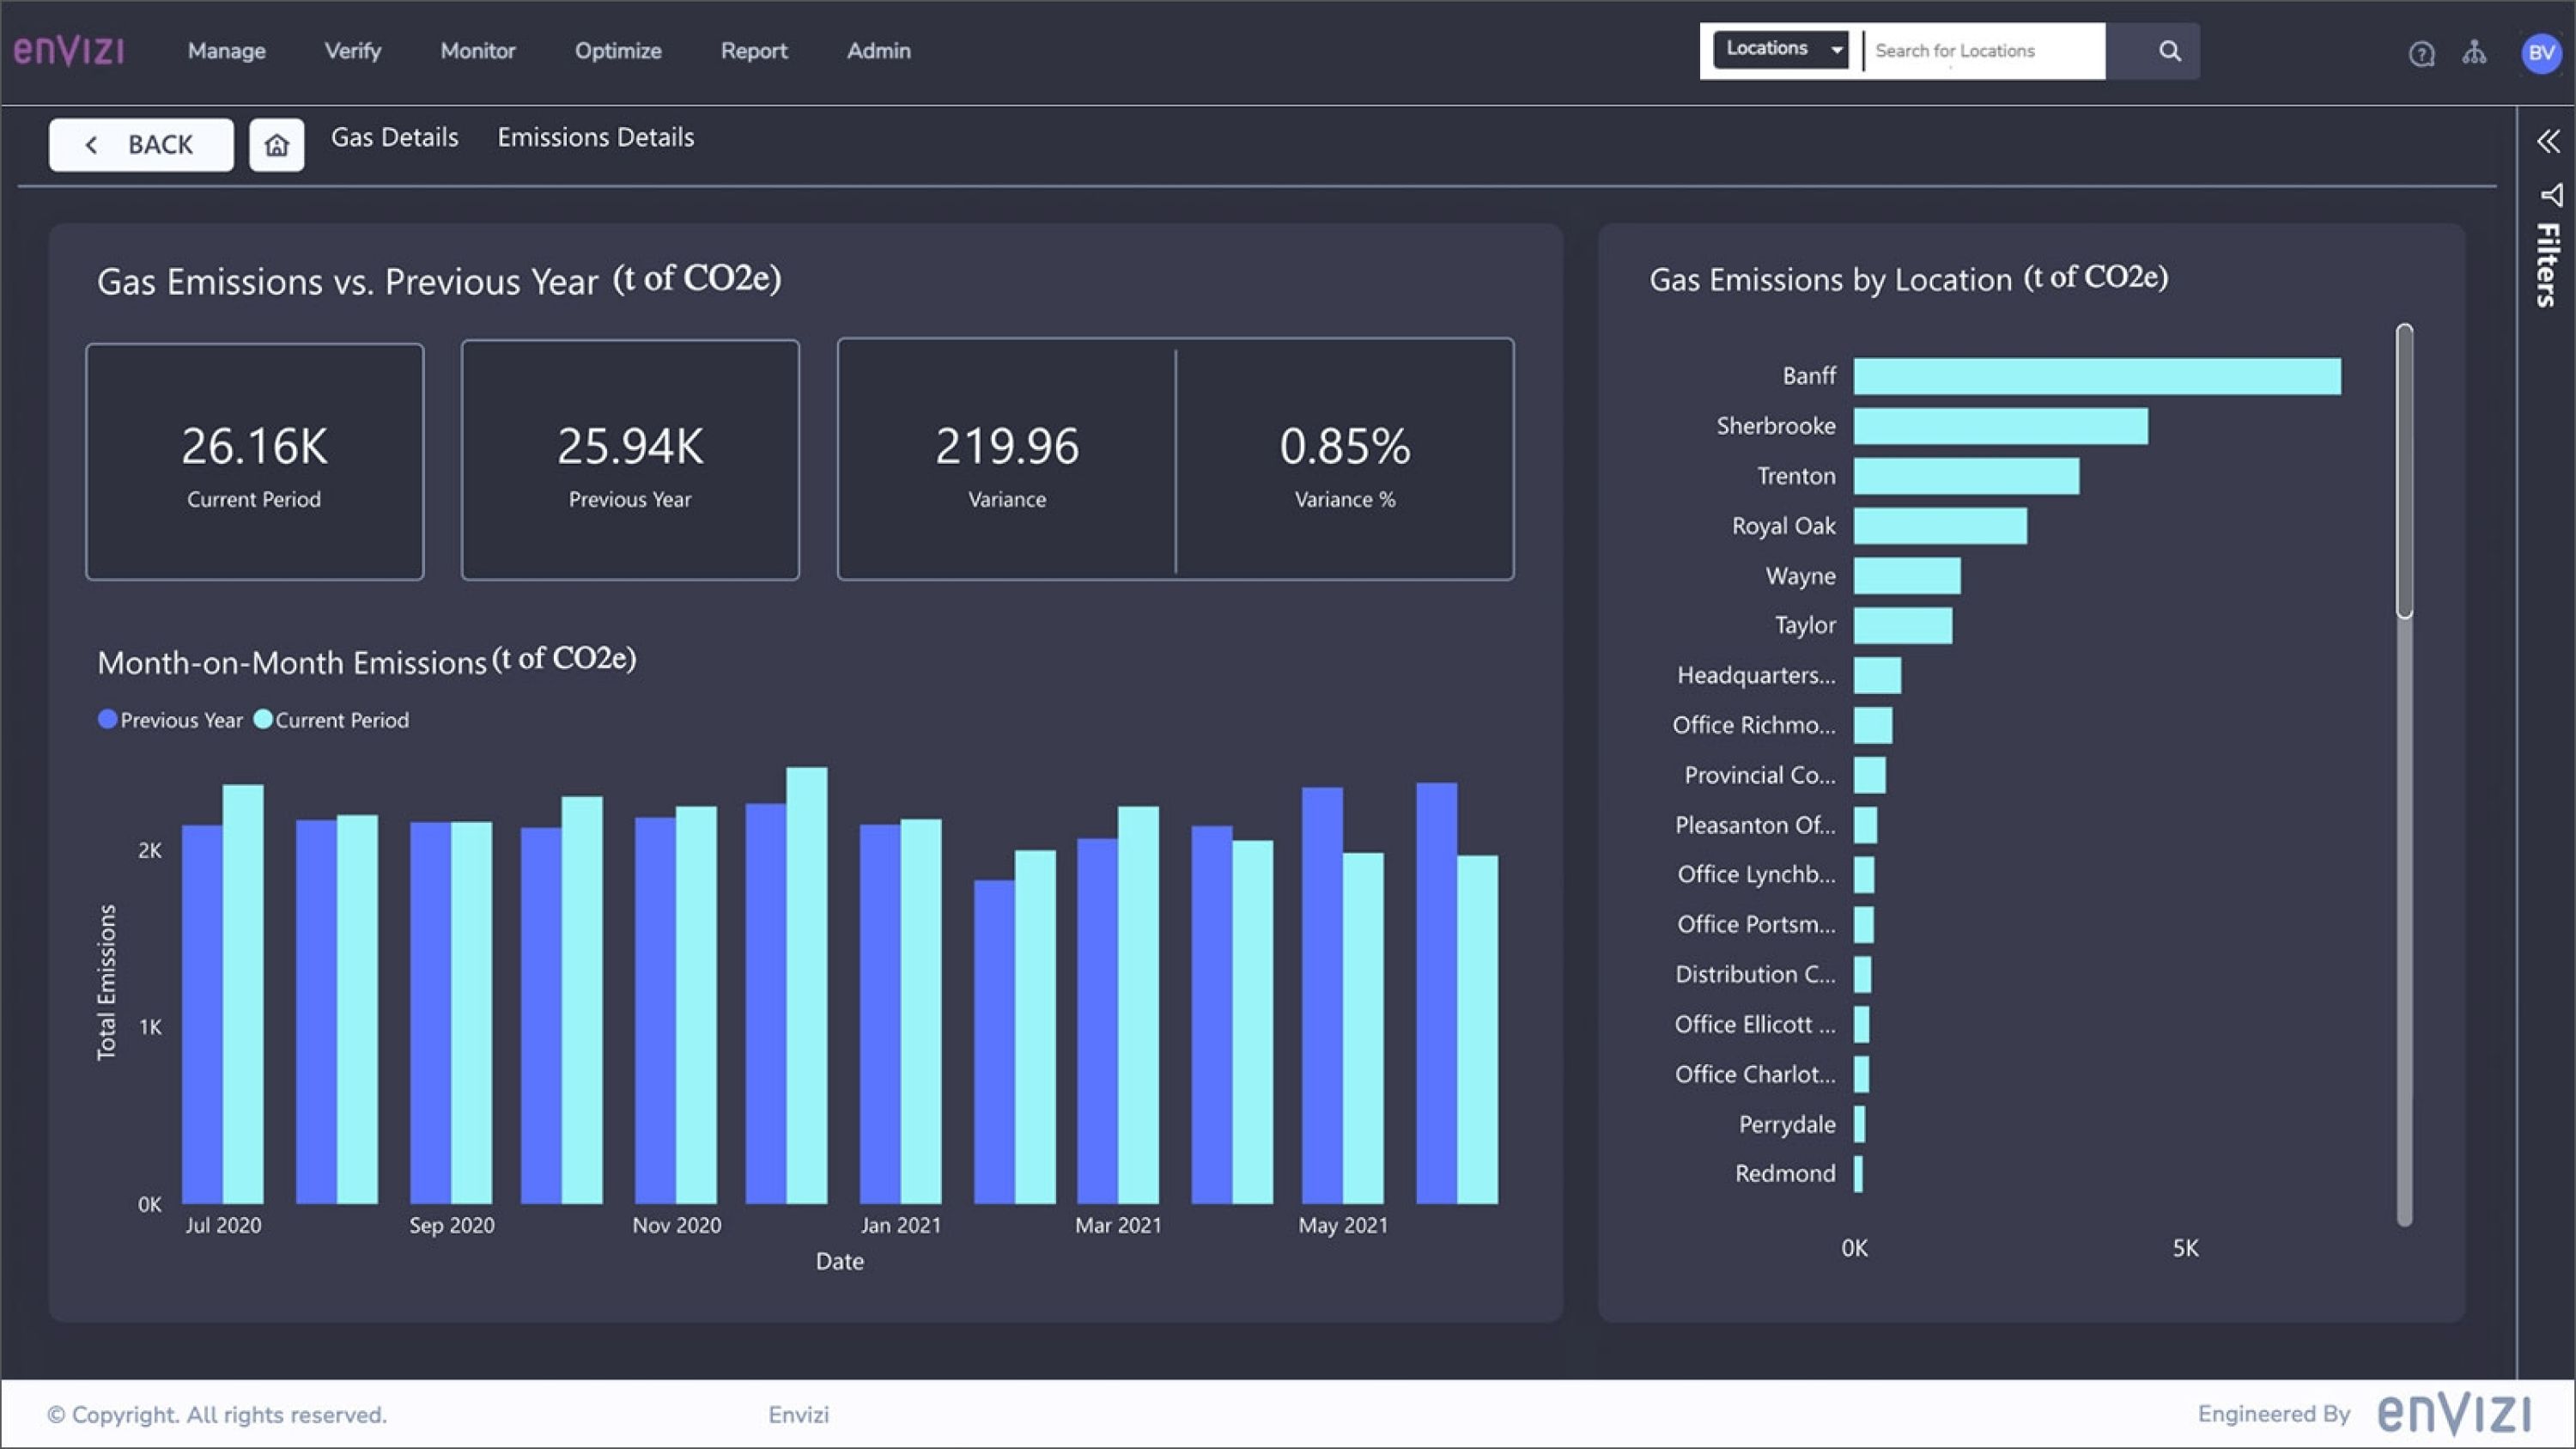 Enable your value chain stakeholders to ask questions and communicate with you or other team members through a single portal. Enable your value chain stakeholders to ask questions and communicate with you or other team members through a single portal.
Metrics conversion engine
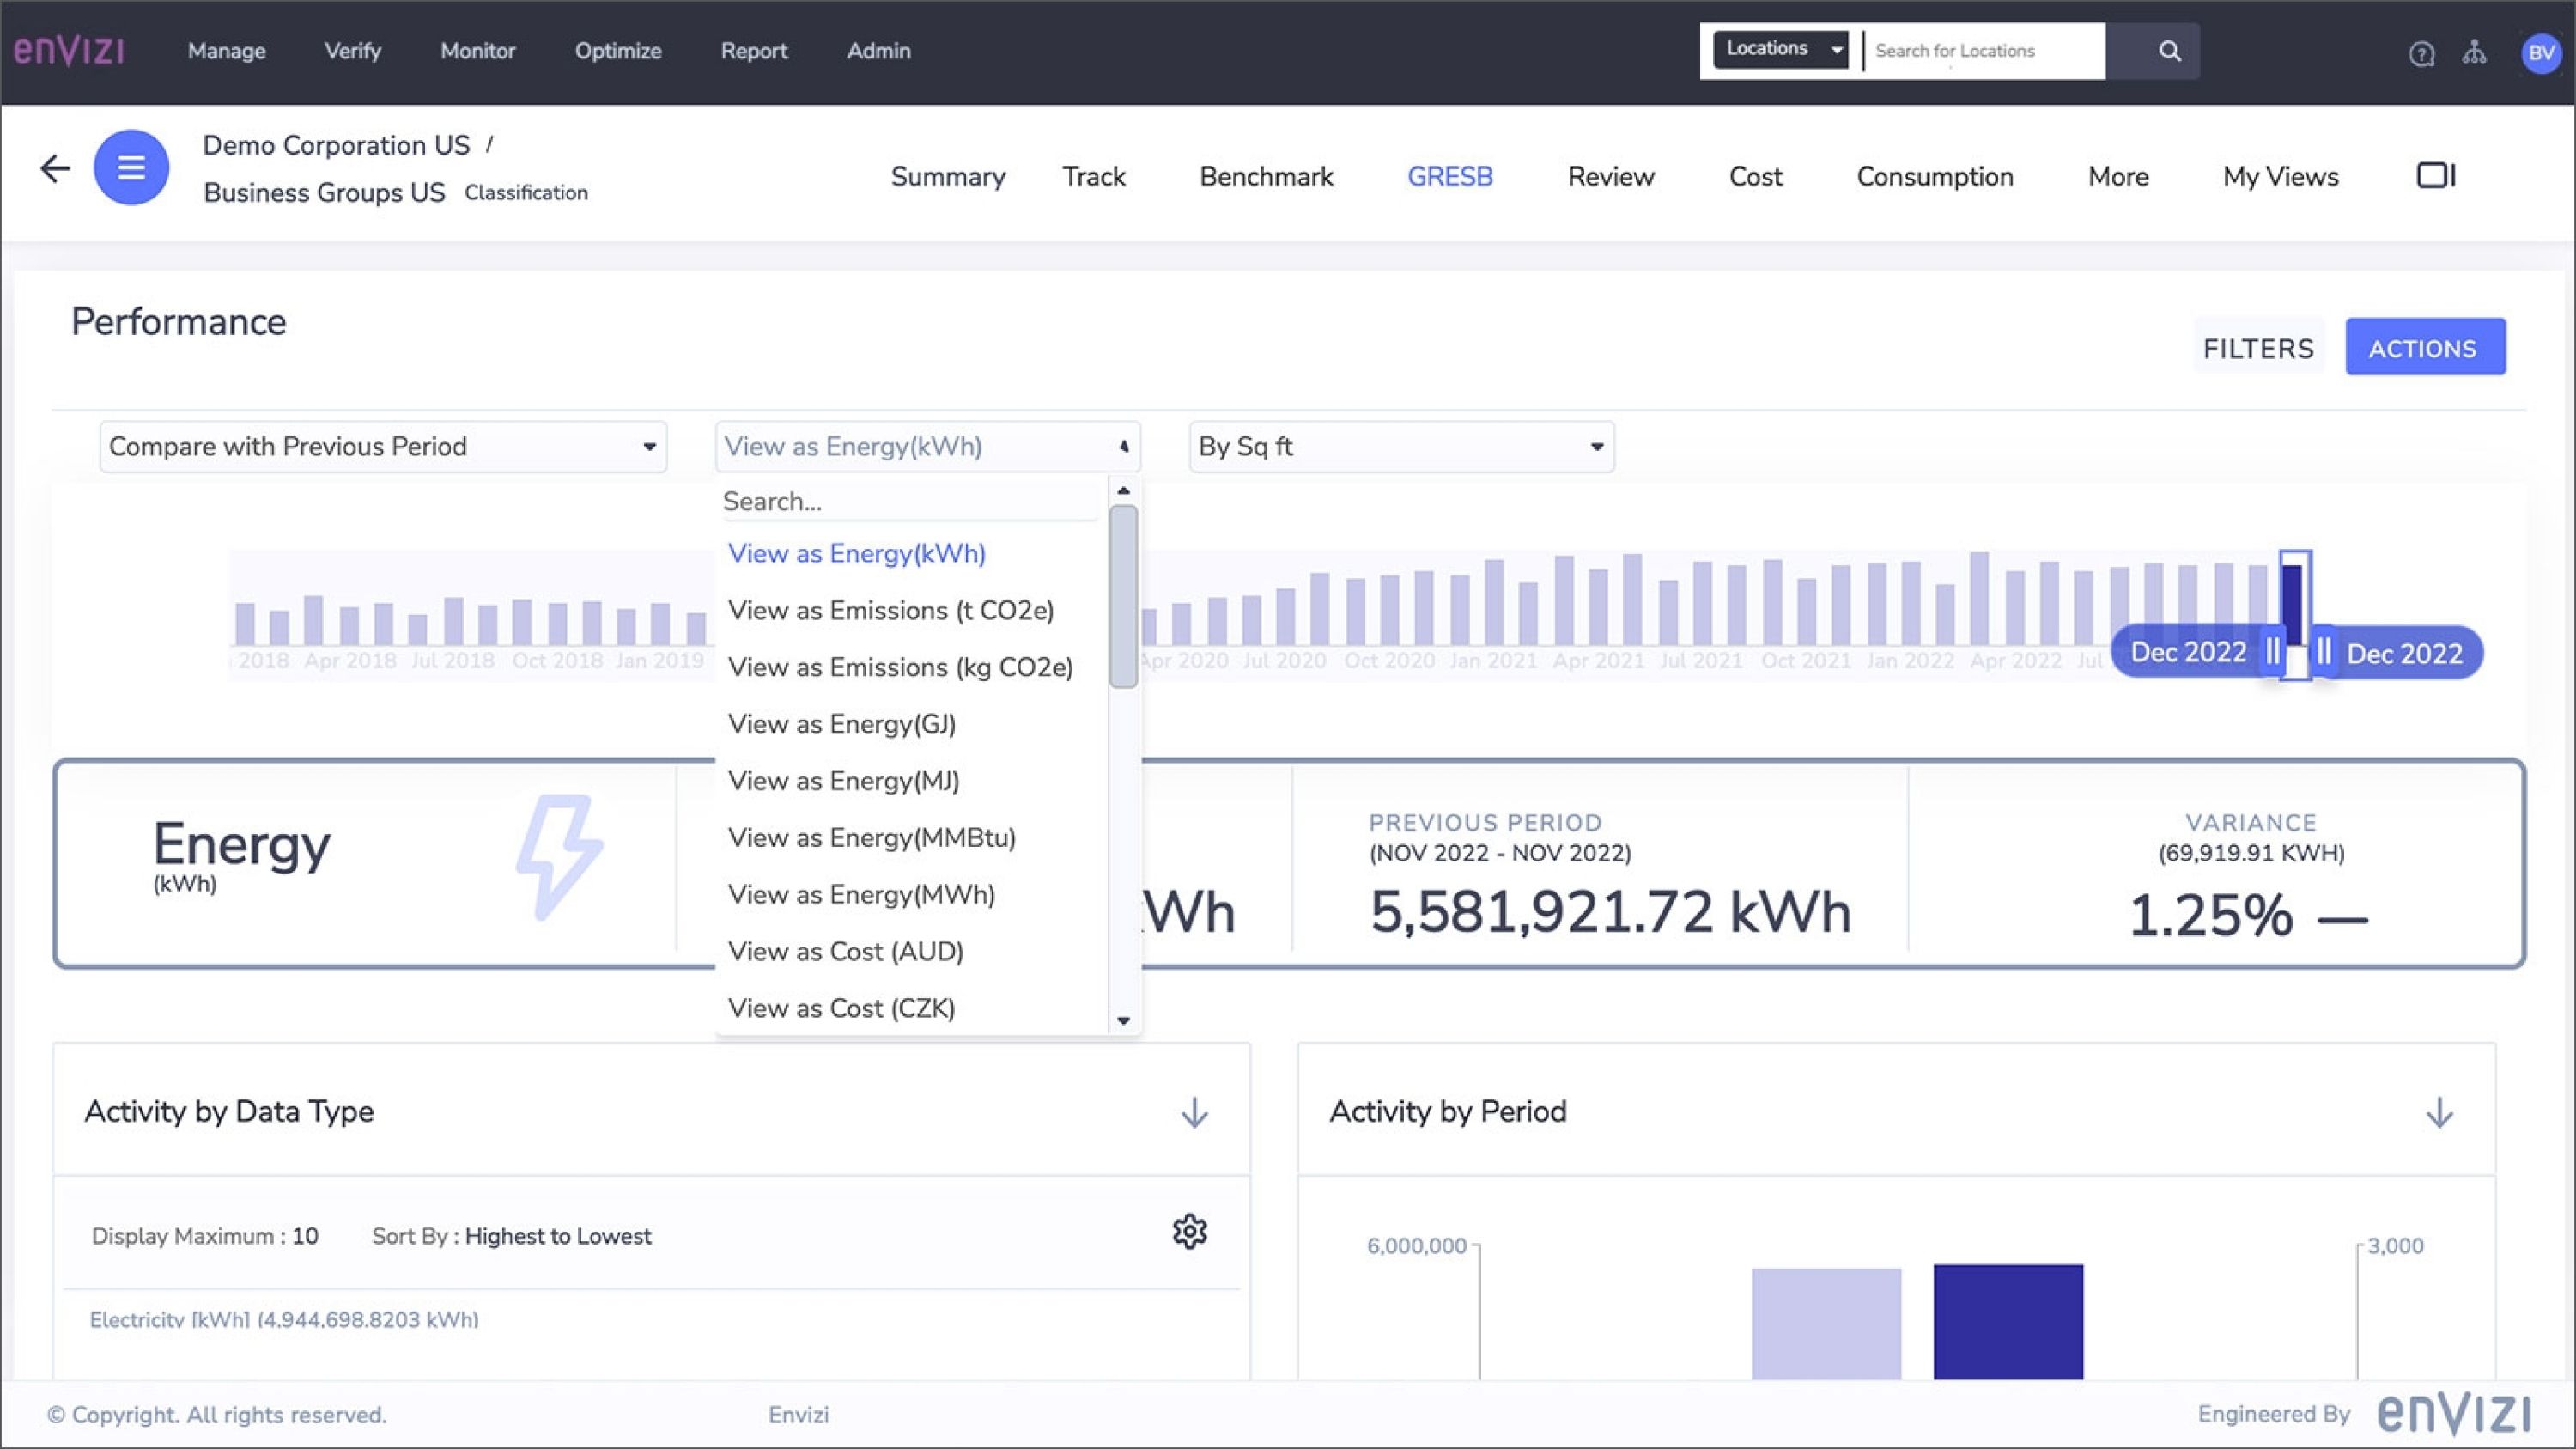 Convert consumption into different metrics to support your reporting requirements without the complexity of spreadsheets and error-prone manual calculations. Convert consumption into different metrics to support your reporting requirements without the complexity of spreadsheets and error-prone manual calculations.
Utility variance analysis
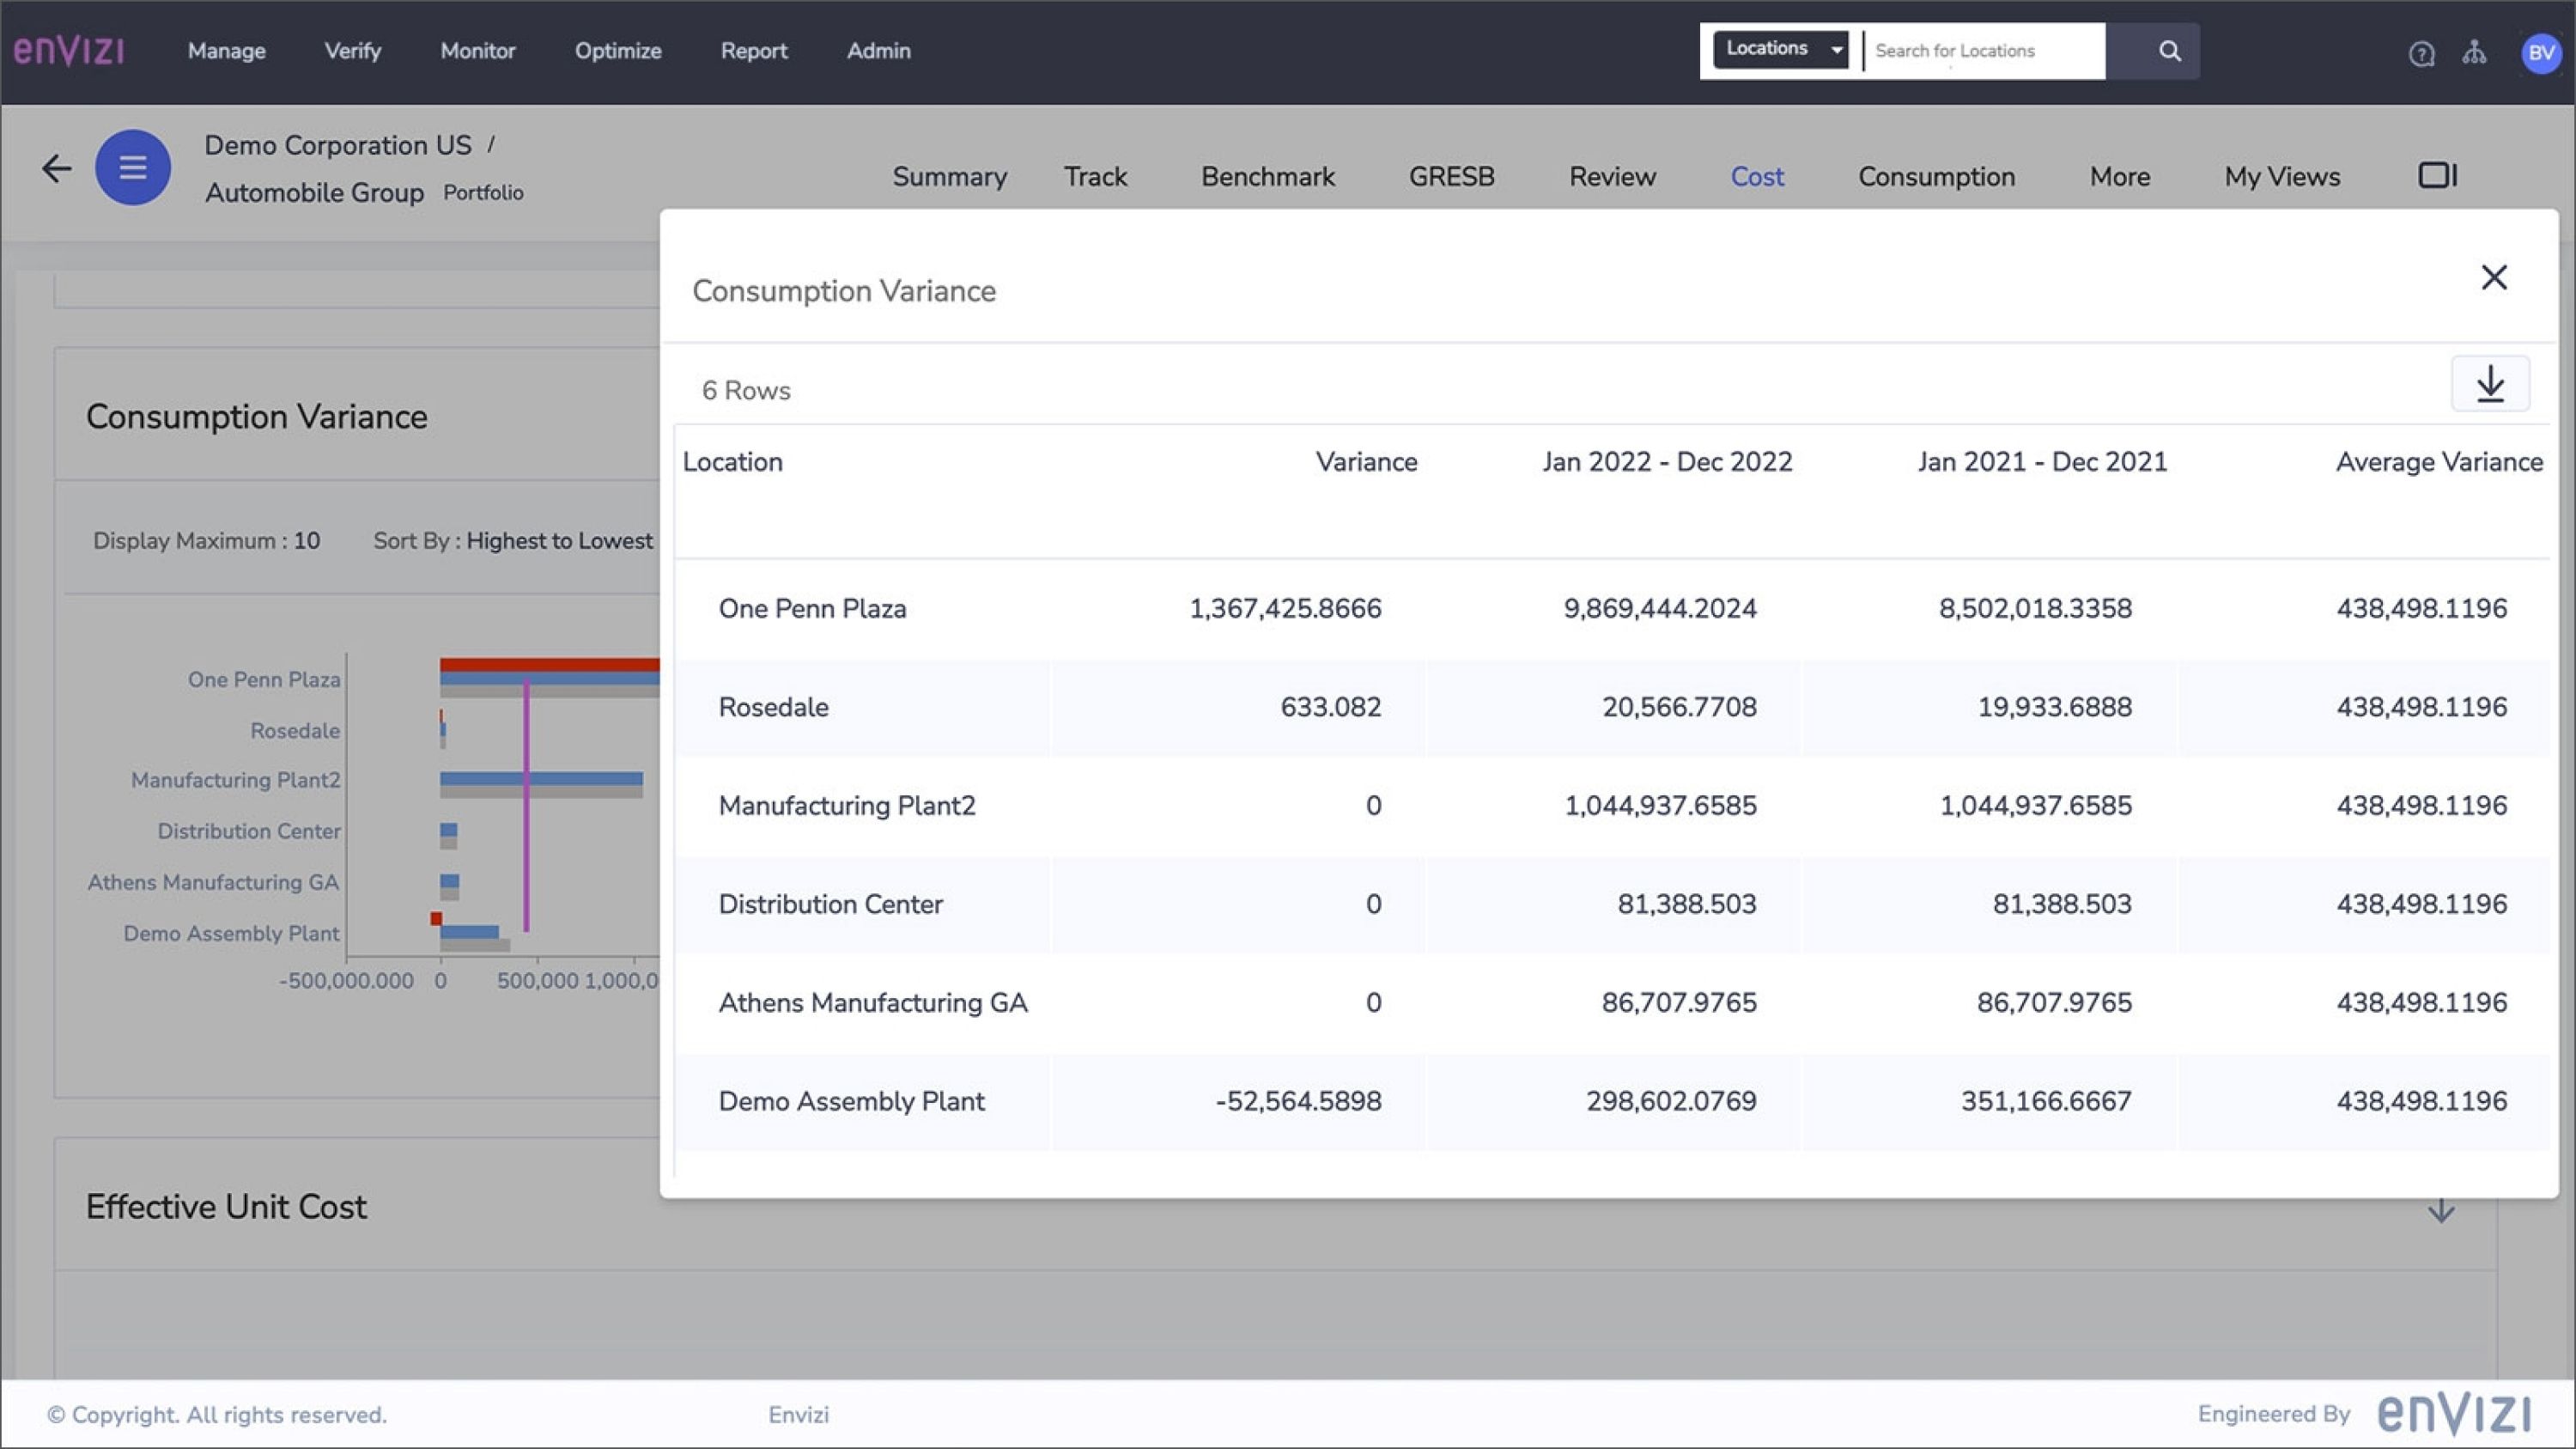 Identify significant variances in your utility cost and consumption data that can impact your bottom line. Identify significant variances in your utility cost and consumption data that can impact your bottom line.
More features
Integrated regression modeler
Envizi's built-in regression modeling tool normalizes energy performance for weather and KPI metrics so you can measure and verify savings over time. |
Advanced filtering
Apply filters to take a closer look across the organization and pinpoint which groups are contributing most to your utility consumption, cost and emissions |
Flexible data visualizations
Leverage Microsoft Power BI-embedded Envizi PowerReports to make interpreting and communicating performance a highly intuitive, user-friendly experience. |
Benefits
 |
 |
 |
Save time
Automatically capture all your utility billing data in a single, integrated record with powerful ELT (extract, load and transform) capabilities. |
Reduce costs
Analyze utility cost and consumption data for outliers and unusual variations over time, and take action to minimize waste. |
Drive accountability
Calculate savings achieved over time by comparing actual consumption against historical baselines adjusted for weather. |
|

Automatically capture and analyze interval meter data to inform and accelerate energy efficiency initiatives across facilities
|
Drive energy efficiency across facilities
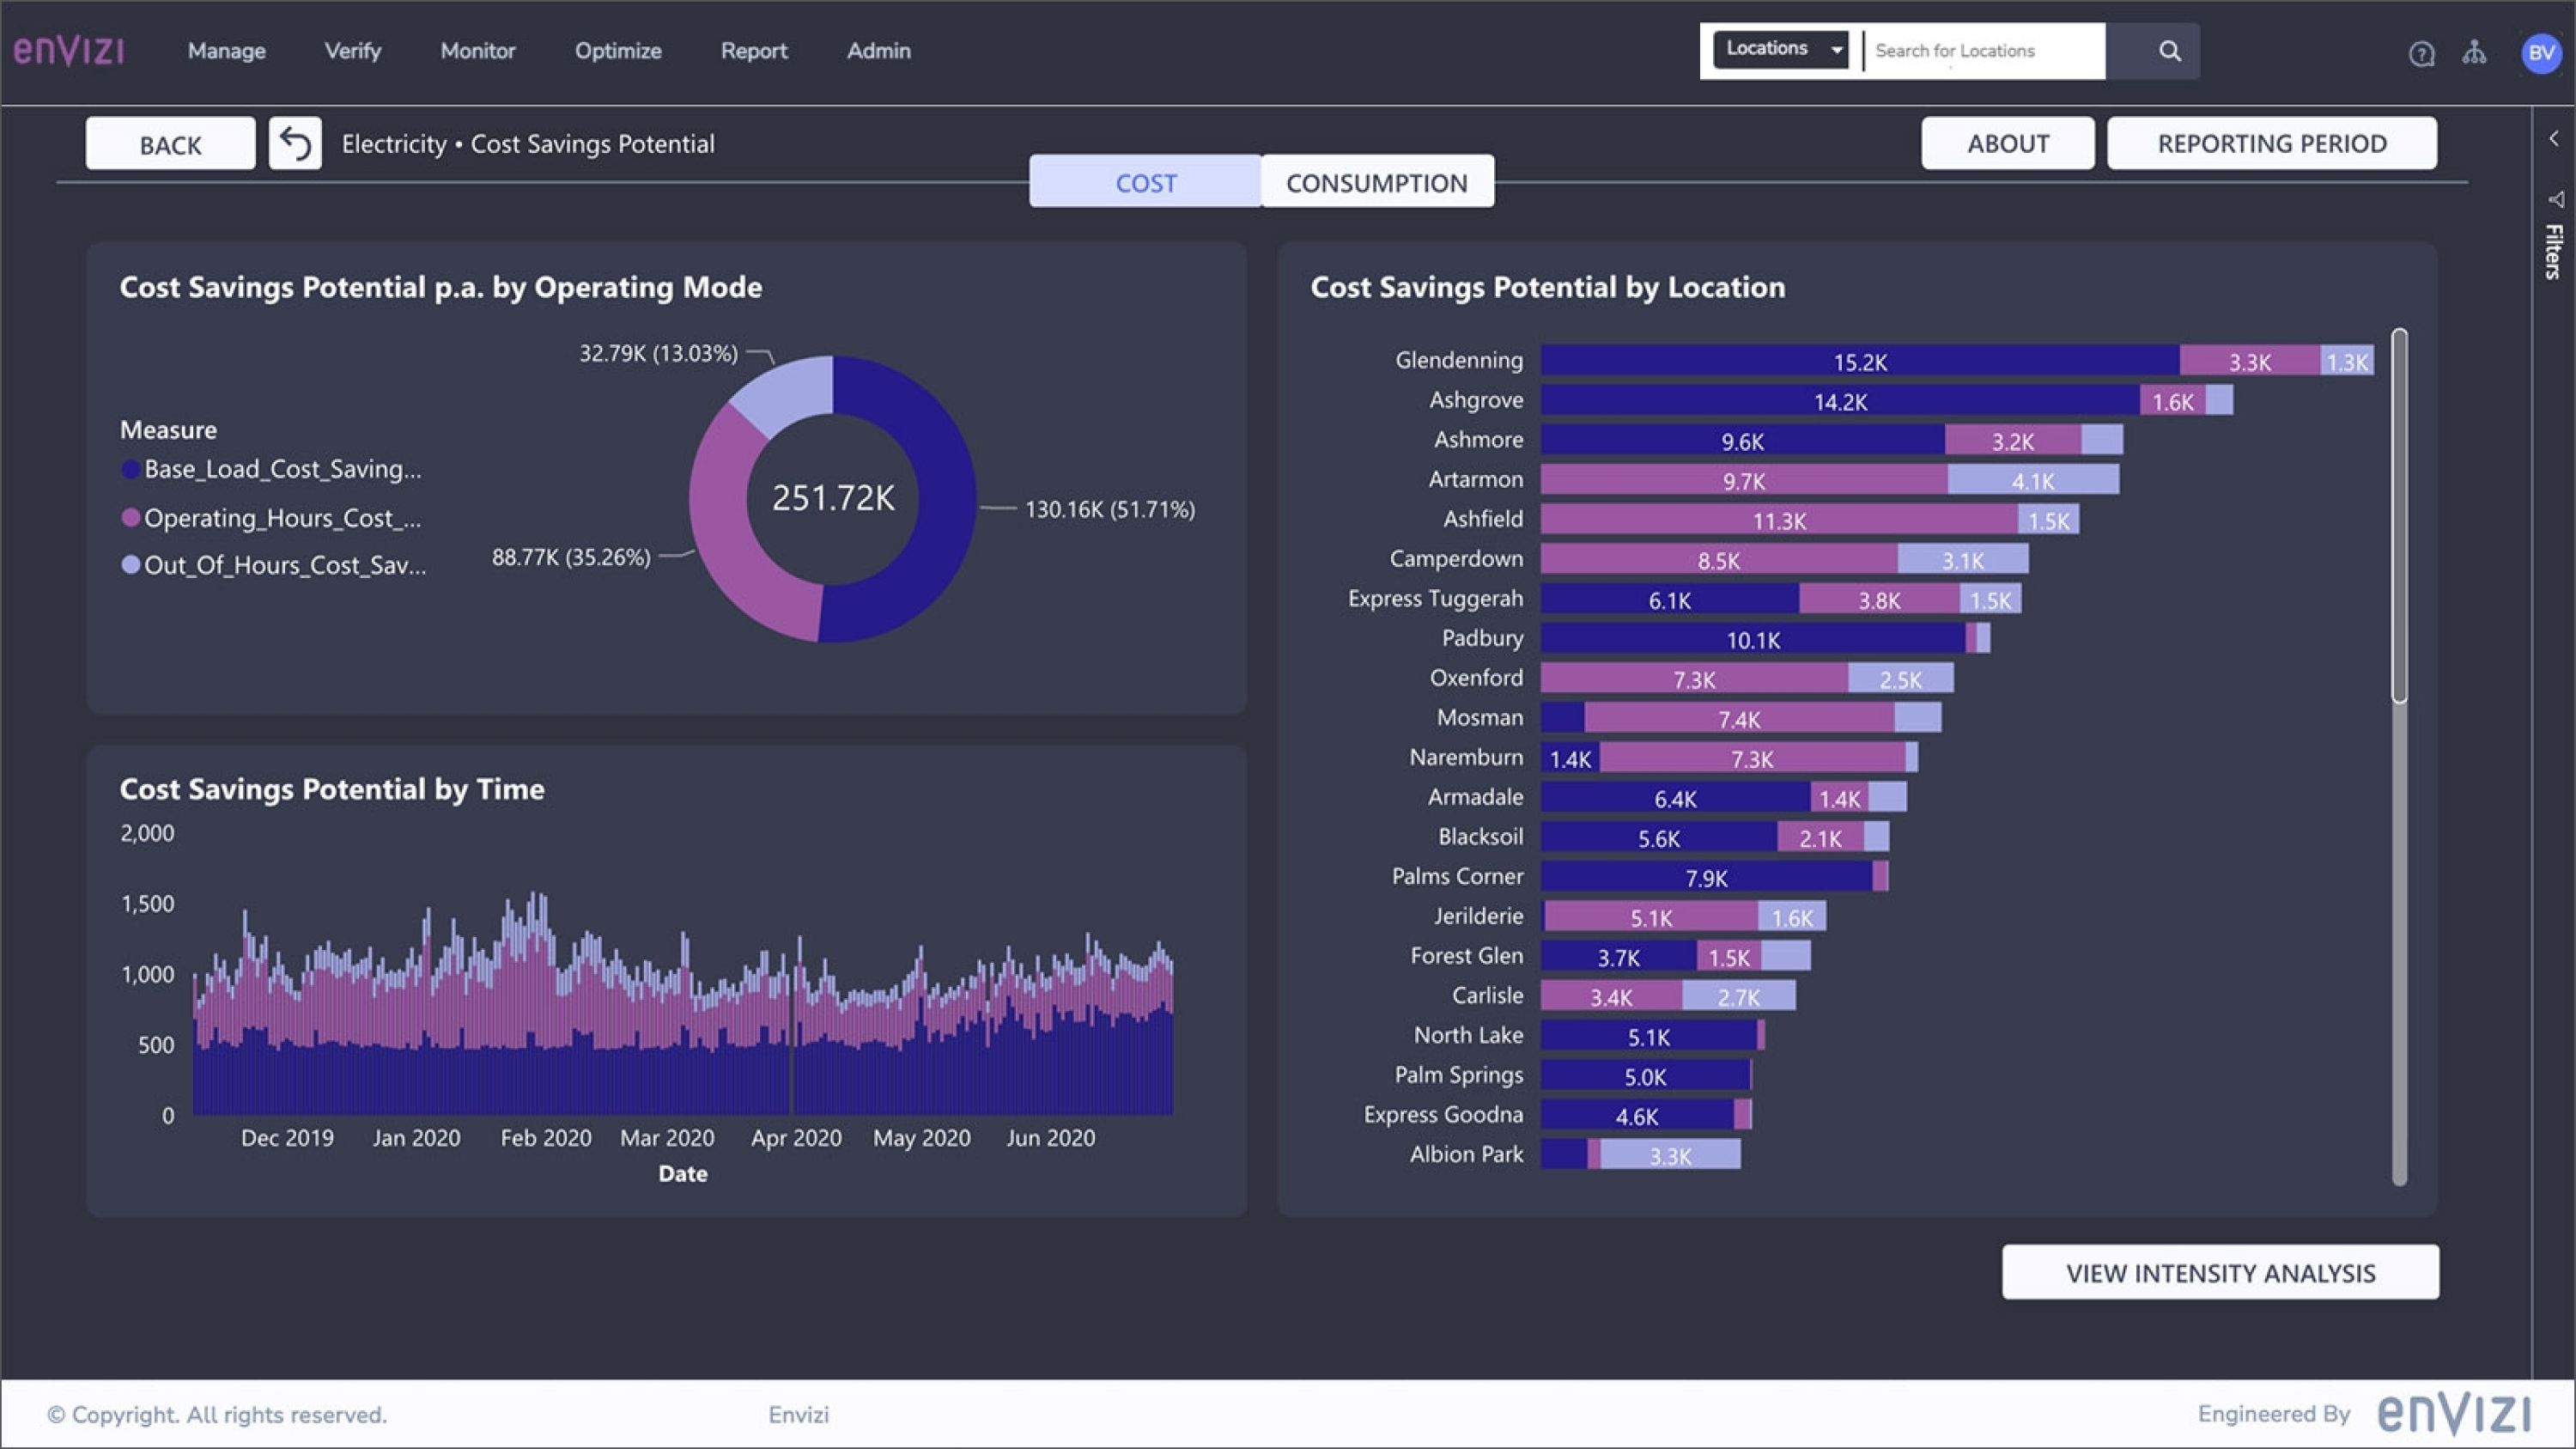 IBM® Envizi™: Interval Meter Analytics consolidates interval meter data from utility meter providers and sub-metering systems to simplify the monitoring of utility demand and consumption data at a granular level. IBM® Envizi™: Interval Meter Analytics consolidates interval meter data from utility meter providers and sub-metering systems to simplify the monitoring of utility demand and consumption data at a granular level.
With powerful data analytics, benchmarking and workflow tools, it provides a contextualized view of interval meter data with other facility attributes to:
- Calculate weather-normalized utility intensities
- Pinpoint inefficient facilities
- Highlight facilities with the highest cost and energy savings potential.
And with features such as virtual meters to combine or split interval data so virtual loads can be represented, and automated capture of interval data, you can start spending more time on action and less on admin.
Module features
Utility performance analysis
 Enable your value chain stakeholders to ask questions and communicate with you or other team members through a single portal. Enable your value chain stakeholders to ask questions and communicate with you or other team members through a single portal.
Metrics conversion engine
 Convert consumption into different metrics to support your reporting requirements without the complexity of spreadsheets and error-prone manual calculations. Convert consumption into different metrics to support your reporting requirements without the complexity of spreadsheets and error-prone manual calculations.
Utility variance analysis
 Identify significant variances in your utility cost and consumption data that can impact your bottom line. Identify significant variances in your utility cost and consumption data that can impact your bottom line.
More features
Integrated regression modeler
Envizi's built-in regression modeling tool normalizes energy performance for weather and KPI metrics so you can measure and verify savings over time. |
Advanced filtering
Apply filters to take a closer look across the organization and pinpoint which groups are contributing most to your utility consumption, cost and emissions |
Flexible data visualizations
Leverage Microsoft Power BI-embedded Envizi PowerReports to make interpreting and communicating performance a highly intuitive, user-friendly experience. |
Benefits
 |
 |
 |
Save time
Automatically capture all your utility billing data in a single, integrated record with powerful ELT (extract, load and transform) capabilities. |
Reduce costs
Analyze utility cost and consumption data for outliers and unusual variations over time, and take action to minimize waste. |
Drive accountability
Calculate savings achieved over time by comparing actual consumption against historical baselines adjusted for weather. |
|

Track and manage ESG and sustainability initiatives to ensure program outcomes are achieved on time and within budget
|
Single platform to capture and report ESG and sustainability data
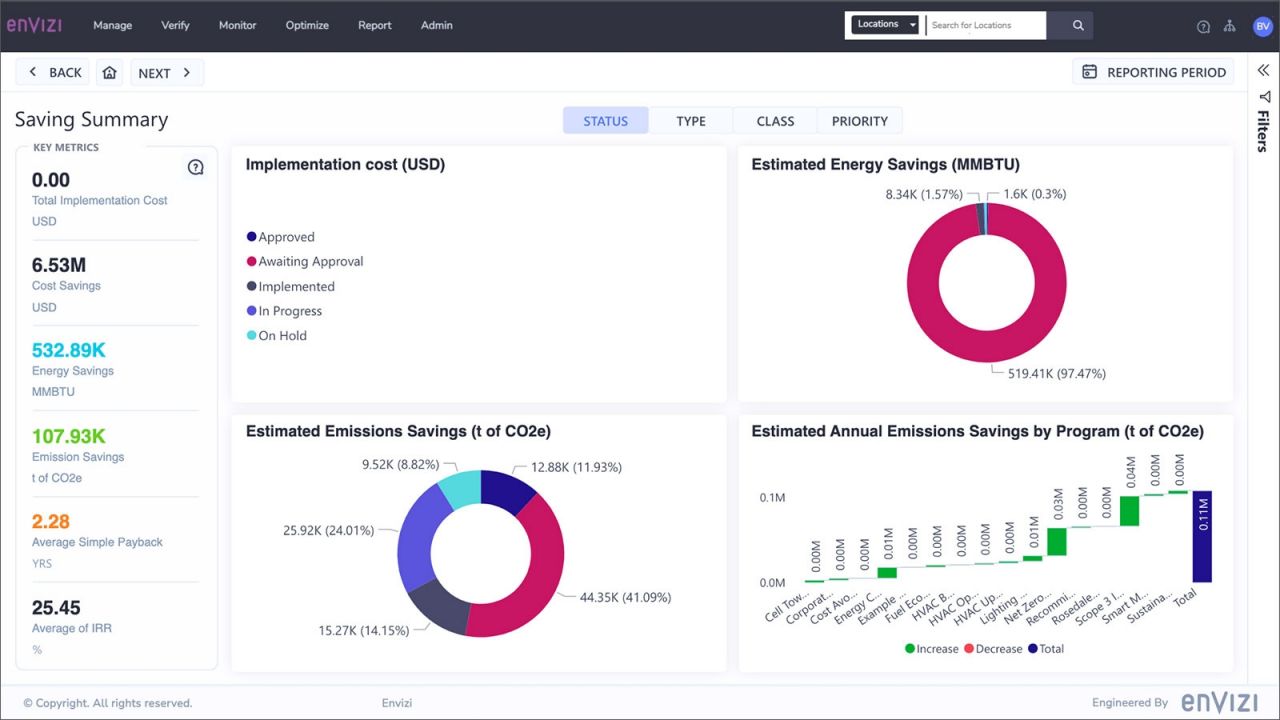 IBM® Envizi™: Sustainability Program Tracking, a robust sustainability management software, simplifies data collection by capturing and tracking ESG and sustainability program data such as forecasts, timelines, cash flow, objectives and deliverables in a central system. IBM® Envizi™: Sustainability Program Tracking, a robust sustainability management software, simplifies data collection by capturing and tracking ESG and sustainability program data such as forecasts, timelines, cash flow, objectives and deliverables in a central system.
As a result, you gain complete oversight of your organization's ESG and sustainability initiatives—from waste and water programs to CSR and community investments—with all your data captured in one place.
Additionally, by using PowerReports (embedded Microsoft Power BI) for sustainability reporting, you can easily compare projects across your portfolio and supply chain to ensure you are always prioritizing the most impactful ESG projects.
Module features
Scenario modeling tool
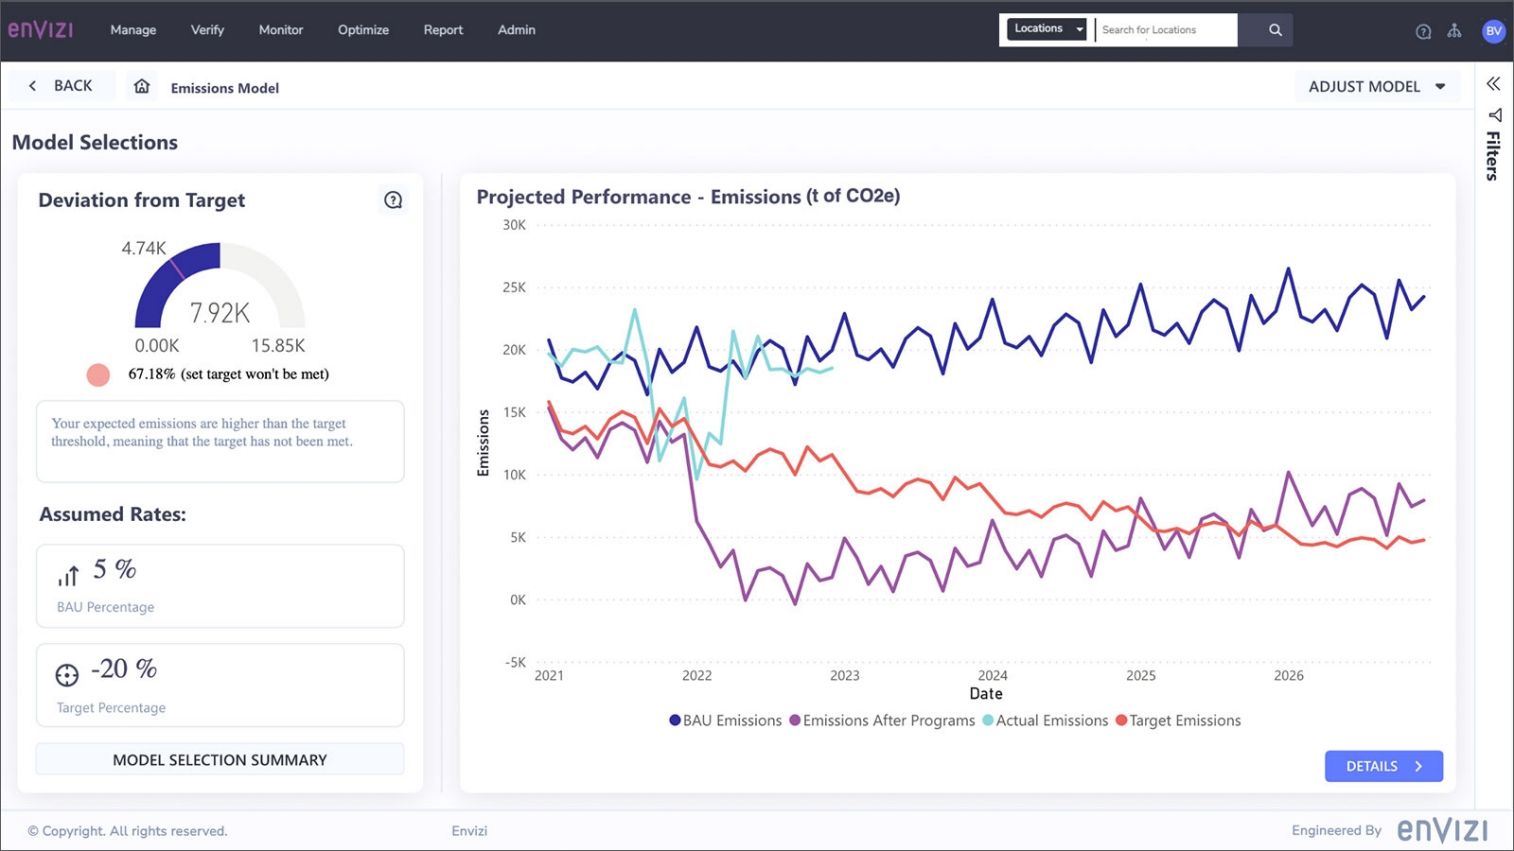 Assess and report on the potential impact of projects based on different scenarios using the Scenario Modeler Tool, eliminating the need to drive sustainability initiatives without insights into possible impact. Assess and report on the potential impact of projects based on different scenarios using the Scenario Modeler Tool, eliminating the need to drive sustainability initiatives without insights into possible impact.
Broad portfolio coverage
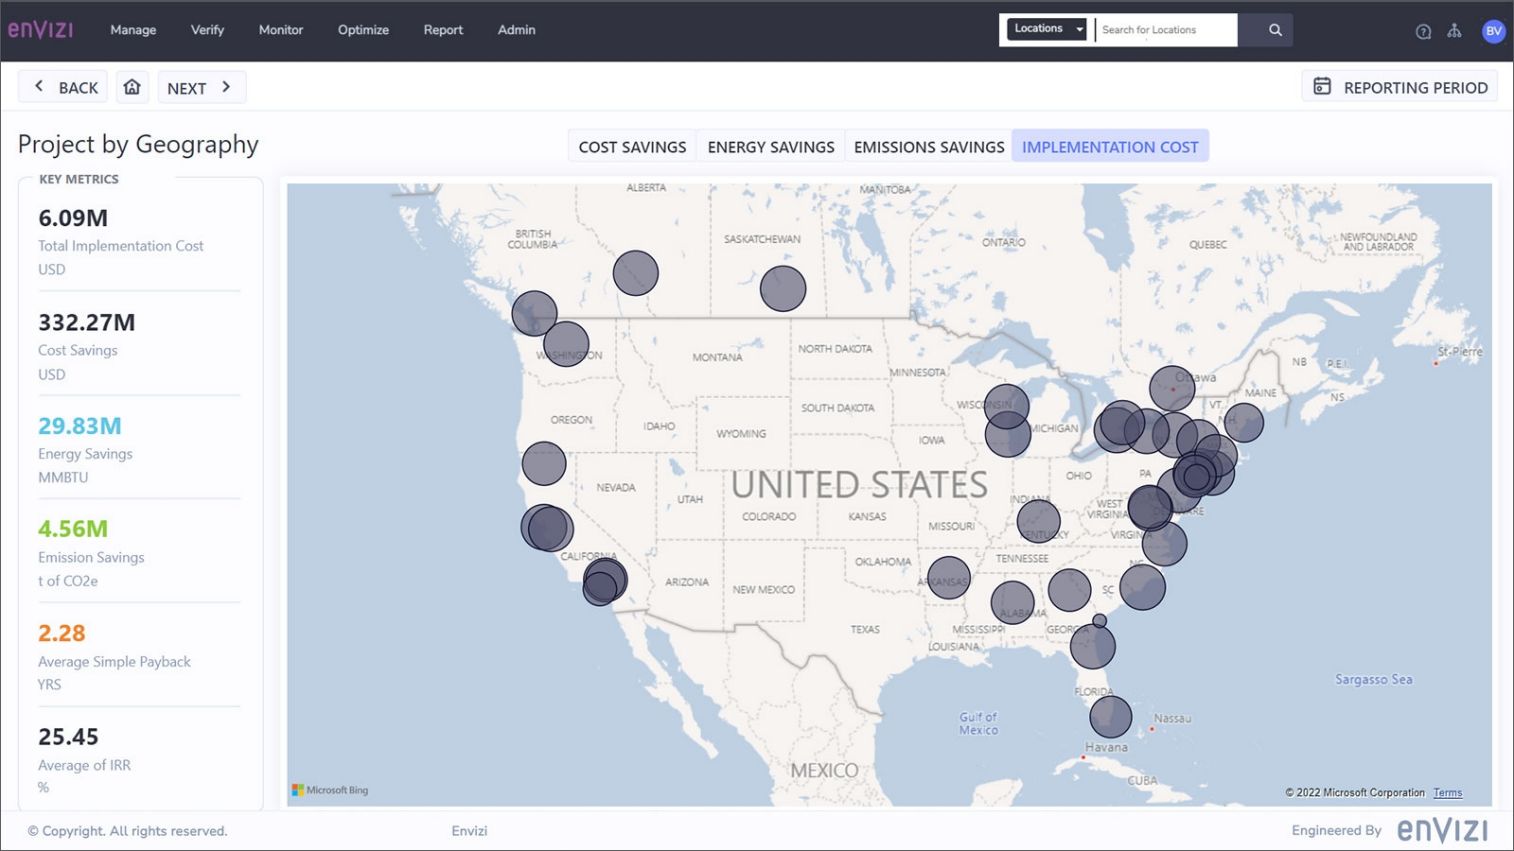 Monitor diverse ESG projects, extending beyond emissions-reduction or energy efficiency programs to monitor other sustainability projects such as waste diversion, water reduction and recycling projects. Monitor diverse ESG projects, extending beyond emissions-reduction or energy efficiency programs to monitor other sustainability projects such as waste diversion, water reduction and recycling projects.
Robust visualizations
 View and monitor sustainability initiatives to track progress and contribution towards your ESG goals. Rank and prioritize sustainability initiatives based on impact and savings. View and monitor sustainability initiatives to track progress and contribution towards your ESG goals. Rank and prioritize sustainability initiatives based on impact and savings.
Project management
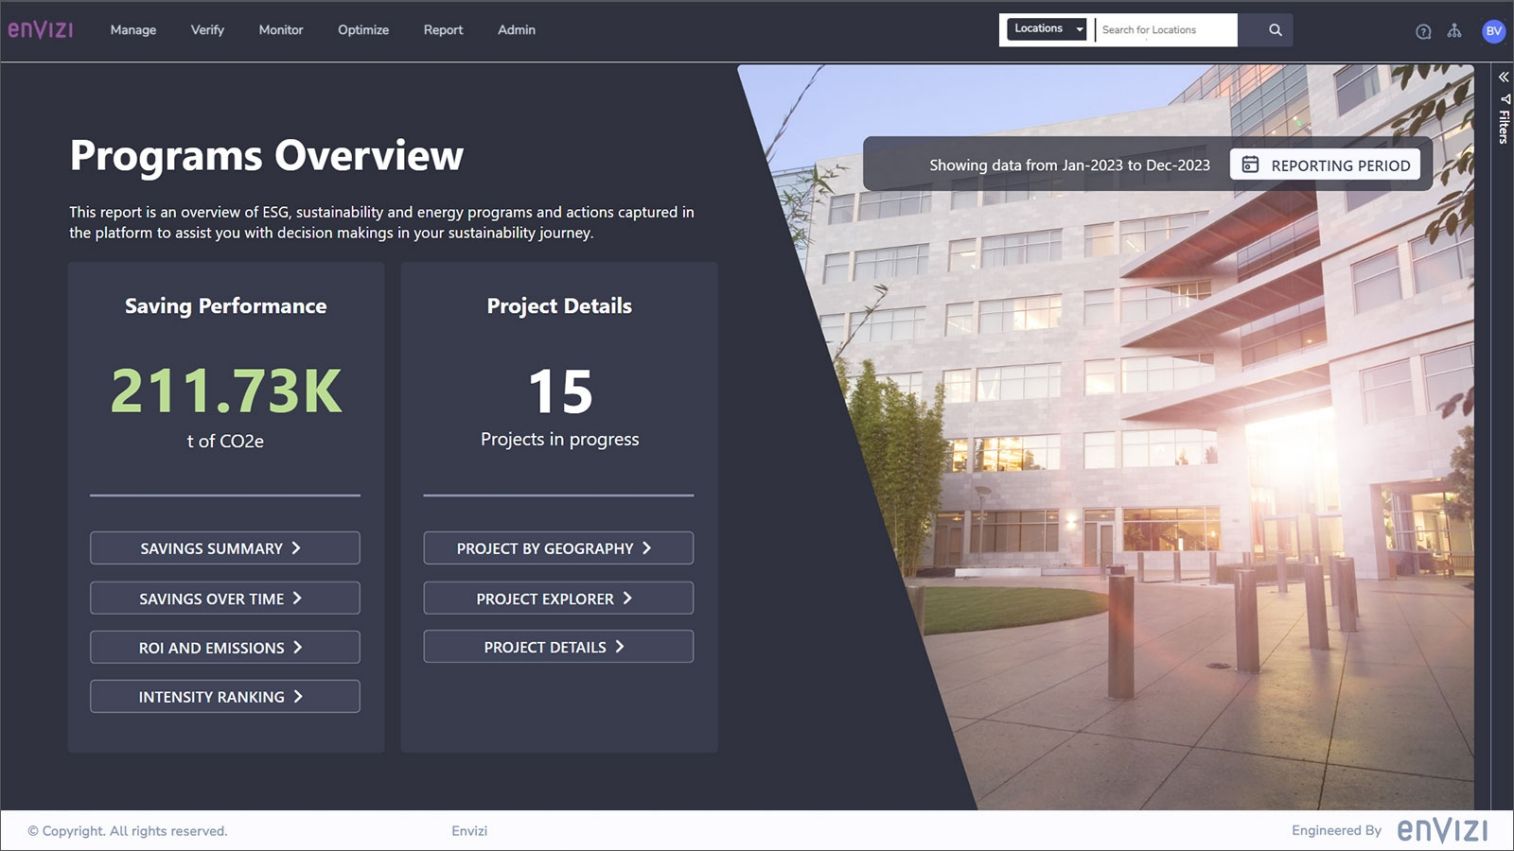 Leverage end-to-end project management features designed for your ESG and sustainability initiatives, from idea conception to project completion, so you have one record to refer to. Leverage end-to-end project management features designed for your ESG and sustainability initiatives, from idea conception to project completion, so you have one record to refer to.
More features
Financial impact calculations
Generate project financial metrics such as internal rate of return (IRR) and net present value (NPV). |
Site-based progress tracking
Monitor which location or group of sites are performing well when compared to their sustainability initiatives milestones and which may require intervention. |
Intuitive dashboards
Visualize and track your sustainability initiatives using PowerReport (embedded Microsoft Power BI) and apply filters to generate the report you need—all within the Envizi platform. |
Benefits
 |
 |
 |
Single system of record
Capture data across all sustainability initiatives in a central system to track the progress and impact of your ESG and sustainability programs. |
Increased accountability
Track progress and assess realized savings and business case assumptions to ensure all stakeholders are held to account. |
Prioritized initiatives
Compare ESG and sustainability projects across your organization to assess and prioritize the most impactful projects that support your ESG and sustainability goals. |
|

.....
|
Single platform to capture and report ESG and sustainability data
IBM® Envizi™: Sustainability Program Tracking, a robust sustainability management software, simplifies data collection by capturing and tracking ESG and sustainability program data such as forecasts, timelines, cash flow, objectives and deliverables in a central system.
As a result, you gain complete oversight of your organization's ESG and sustainability initiatives—from waste and water programs to CSR and community investments—with all your data captured in one place.
Additionally, by using PowerReports (embedded Microsoft Power BI) for sustainability reporting, you can easily compare projects across your portfolio and supply chain to ensure you are always prioritizing the most impactful ESG projects.
|
|
|
| |
ABS provides IBM Envizi Consulting Services
A Better Solution, Inc. provides seasoned
IBM Certified Envizi Consultants
with the experience of several installations under their belt.
Take a look at some
consultants
that provide expert
Envizi Consulting Services.
You can request or
inquire
about our IBM Envizi Consulting Services
here
or email us at
info@abs-consulting.com.
|
|
|
©2026 A Better Solution, Inc. All rights reserved. --- Privacy & Terms
|
Follow us here:     |
|
|


 IBM Envizi ESG Suite
 Today's leaders are excited and energized by the chance to reimagine business and commerce with a sustainability-first mindset. IBM Envizi ESG Suite removes the challenges and complexity of ESG data collection, analysis and reporting so you can harness the power of data to fast-track your success.


 Custom emissions factors
 GHG reductions management


 IBM® Envizi™: Scope 3 GHG Accounting + Reporting software leverages AI to help make emissions calculations more efficient. It includes flexible reporting tools to deliver value chain insights and streamline disclosures and offers embedded Scope 3 emissions factor libraries to make calculations less time consuming.
 Robust calculation engine
 Calculation accuracy summary
 PowerReports


 IBM® Envizi™: Target Setting + Tracking simplifies and automates the process of capturing and tracking GHG performance against targets at different levels of the organization. With all your GHG emissions data available in one place, organizations can easily set different types of targets, including energy, cost, emissions or intensity.
 Rate analysis dashboard
 Performance dashboards


 Input all data against framework questions within Envizi so you don't need to access each external reporting framework separately.
 Create custom questions to track specific reporting requirements not covered by the public ESG frameworks.
 Framework questions include Envizi's best practice guidance on responding, as well as where to source the ESG metrics in Envizi.


 IBM® Envizi™: Building Ratings + Benchmarks reporting software allows you to capture, analyze and track building footprint metrics across your entire property portfolio.
 As an official GRESB Data Partner, Envizi captures, tags and reports on GRESB performance indicators directly via API to the GRESB Portal in a format compatible with the framework.
 Integrate directly with the ENERGY STAR Portfolio Manager to receive official ENERGY STAR scores and track current and historical performance trends.
 Calculate indicative NABERS Office, Energy and Water ratings to the decimal using the built-in NABERS algorithm for easy and accessible portfolio-level reporting.


 IBM® Envizi™: Value Chain Surveys + Assessments, an interactive value chain analysis software, simplifies the capture of ESG data from stakeholders for value chain analysis.
 Enable your value chain stakeholders to ask questions and communicate with you or other team members through a single portal.
 Allow your value chain stakeholders to attach supporting documentation such as reports or policies, against your customized survey questions.


 IBM® Envizi™: Utility Bill Analytics software saves you time by consolidating your utility billing data, automating conversions and calculations and normalizing energy performance for weather and KPI metrics.
 Enable your value chain stakeholders to ask questions and communicate with you or other team members through a single portal.
 Convert consumption into different metrics to support your reporting requirements without the complexity of spreadsheets and error-prone manual calculations.
 Identify significant variances in your utility cost and consumption data that can impact your bottom line.


 IBM® Envizi™: Interval Meter Analytics consolidates interval meter data from utility meter providers and sub-metering systems to simplify the monitoring of utility demand and consumption data at a granular level.
 IBM® Envizi™: Sustainability Program Tracking, a robust sustainability management software, simplifies data collection by capturing and tracking ESG and sustainability program data such as forecasts, timelines, cash flow, objectives and deliverables in a central system.
 Assess and report on the potential impact of projects based on different scenarios using the Scenario Modeler Tool, eliminating the need to drive sustainability initiatives without insights into possible impact.
 Monitor diverse ESG projects, extending beyond emissions-reduction or energy efficiency programs to monitor other sustainability projects such as waste diversion, water reduction and recycling projects.
 Leverage end-to-end project management features designed for your ESG and sustainability initiatives, from idea conception to project completion, so you have one record to refer to.


 Envizi FAQ


